Experimental investigation of QCM-derived sticking coefficients

The objective of spacecraft contamination simulation is in determining how much deposition can be expected on some sensitive instrument or a radiator over some prescribed time interval. Generally sensitive components are placed away from major outgassing sources, and thus any contaminants reaching them get there by bouncing off other surfaces. These simulations thus depend on accurate models for surface reemission. A commonly utilized model involves using temperature varying sticking coefficients. The model may say, for example, that the contaminant population has a 100%, 40%, and 0% chance of sticking on -40C, -5C, and +10C surfaces, respectively. The actual temperature variation can be obtained from an experimental characterization of deposition during outgassing tests by performing a so-called thermogravimetric analysis (TGA) on the QCM-collected material. This essentially involves warming up the QCM crystal at a relatively slow rate such as 1C/min to obtain the rate of change of crystal frequency versus temperature.
There is however a problem with this approach. Molecules generally require more than one bounce to reach the sensitive component. Consider multiple -5C surfaces. According to the sticking coefficient model, 60% of the incident flux reflects on the first impact. Of this reflected flux, another 60% reflects on the second impact, and so on. After “k” wall impacts, the incident flux got reduced by a factor 0.6k. But this is not quite right. The contaminant population is really a “soup” of multiple different species. On the first impact, some of these species may stick more-or-less permanently, while other lighter species reflect. These reflected species will not collect on the subsequent impacts on surfaces of the same temperature. They will keep bouncing around until encountering a yet colder surface at which they eventually deposit.
University of Southern California
That was my hunch, at least. Well between 2020 and 2022 I got a chance to prove this experimentally. As some of you know, I recently starting working at University of Southern California (USC) Department of Astronautical Engineering as a part time lecturer for upper undergraduate class on scientific computing (ASTE-404) and a graduate class on computational plasmas (ASTE-546).. This is where my master’s thesis advisor Prof. Joseph Wang now works. Being at USC provided me with the opportunity to work with Prof. Wang’s students, including Elana Helou who is pursuing her Ph.D. We started by refurbishing a 40 cm top loader chamber that was figuratively – and literally – collecting dust for years. We managed to source a clean dry scroll roughing pump and a turbomolecular high vacuum pump, “borrowed” an RGA from another chamber, and integrated a QCM loaned to us by NASA.
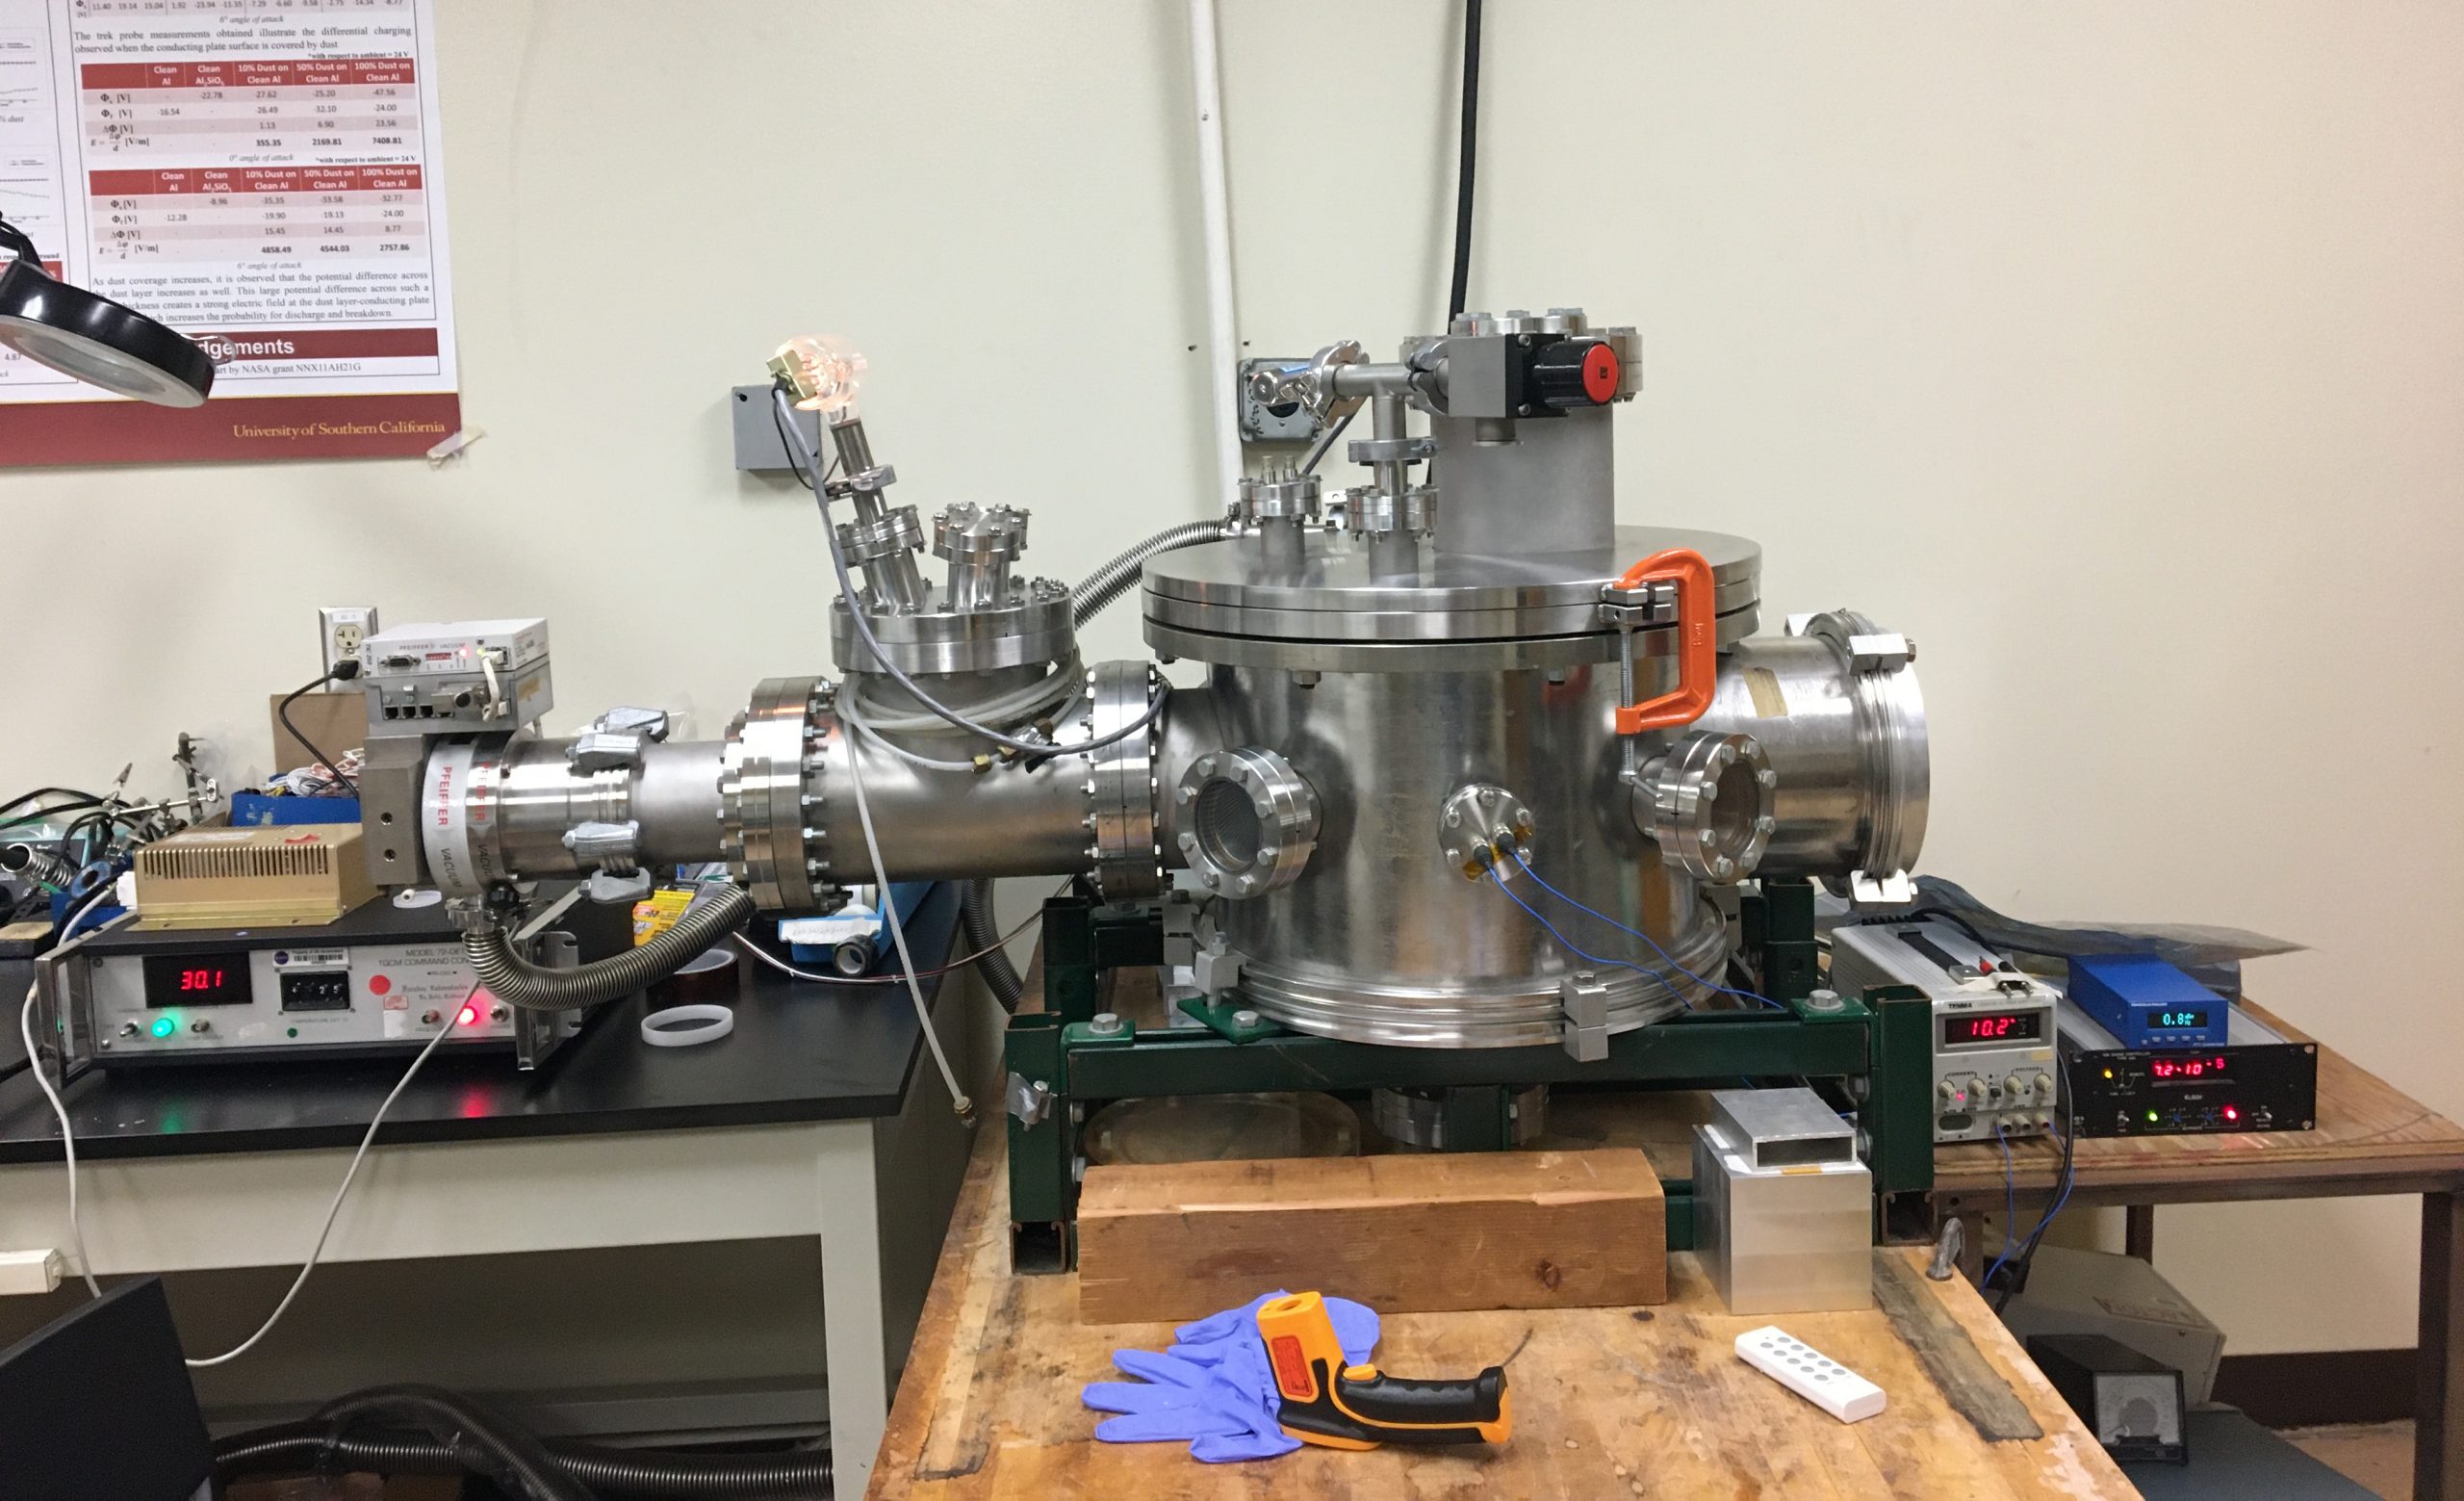
The idea for the experiment was using one QCM with a directly line of sight to an outgassing to obtain the temperature-varying sticking coefficient for the mathematical contaminant species. We would then use this coefficient to numerically simulate the deposition that can be expected on a second QCM facing the wall, and having no line of sight to the source. Any molecules reaching it would need to undergo bounces off the isothermal chamber walls. In other words, knowing a source outgassing rate and the “state of the art” deposition behavior, can we predict the gray-body mass transport to another collector? My guess was that the answer will be a “no”, and that is indeed what was found. Due to having just one QCM, the work at USC involved breaking vacuum after each outgassing experiment and re-orienting the QCM to face the wall. At this time, my collaborators at Blue Origin volunteered one of their chambers for a parallel experiment. This chamber allowed us to perform both collections concurrently by utilizing two QCMs. Results from this work can be found in our 2022 SPIE Optics and Photonics paper Experimental investigation of QCM-derived sticking coefficients for use in molecular transport simulations, co-authored by me, Elana Helou, Tianxiang Zhao, and Joseph Wang from USC, as well as Denisse Aranda, Vince
Green, and Syed Iqbal from Blue Origin. Findings from this work were also previously presented at the 2021 NASA Goddard Contamination Control, Materials, and Planetary Protection (CCMPP) workshop, as well as at the 2023 European Contamination Workshop at Toulouse, France. The USC data and the companion simulation inputs are publicly available, so please reach out if you would like a copy.
Here we now briefly describe the experiment. Please refer to the just mentioned paper for more information. Figure 2 visualizes the configuration used at USC. The two pictures show the same QCM in orientation 1, facing the sample, and orientation 2, facing the wall. We used a wire bundle placed on a heater pad, constructed by wrapping nickel chromium wire in Kapton, as the contaminant source. The third pictures shows a top down view into the chamber.
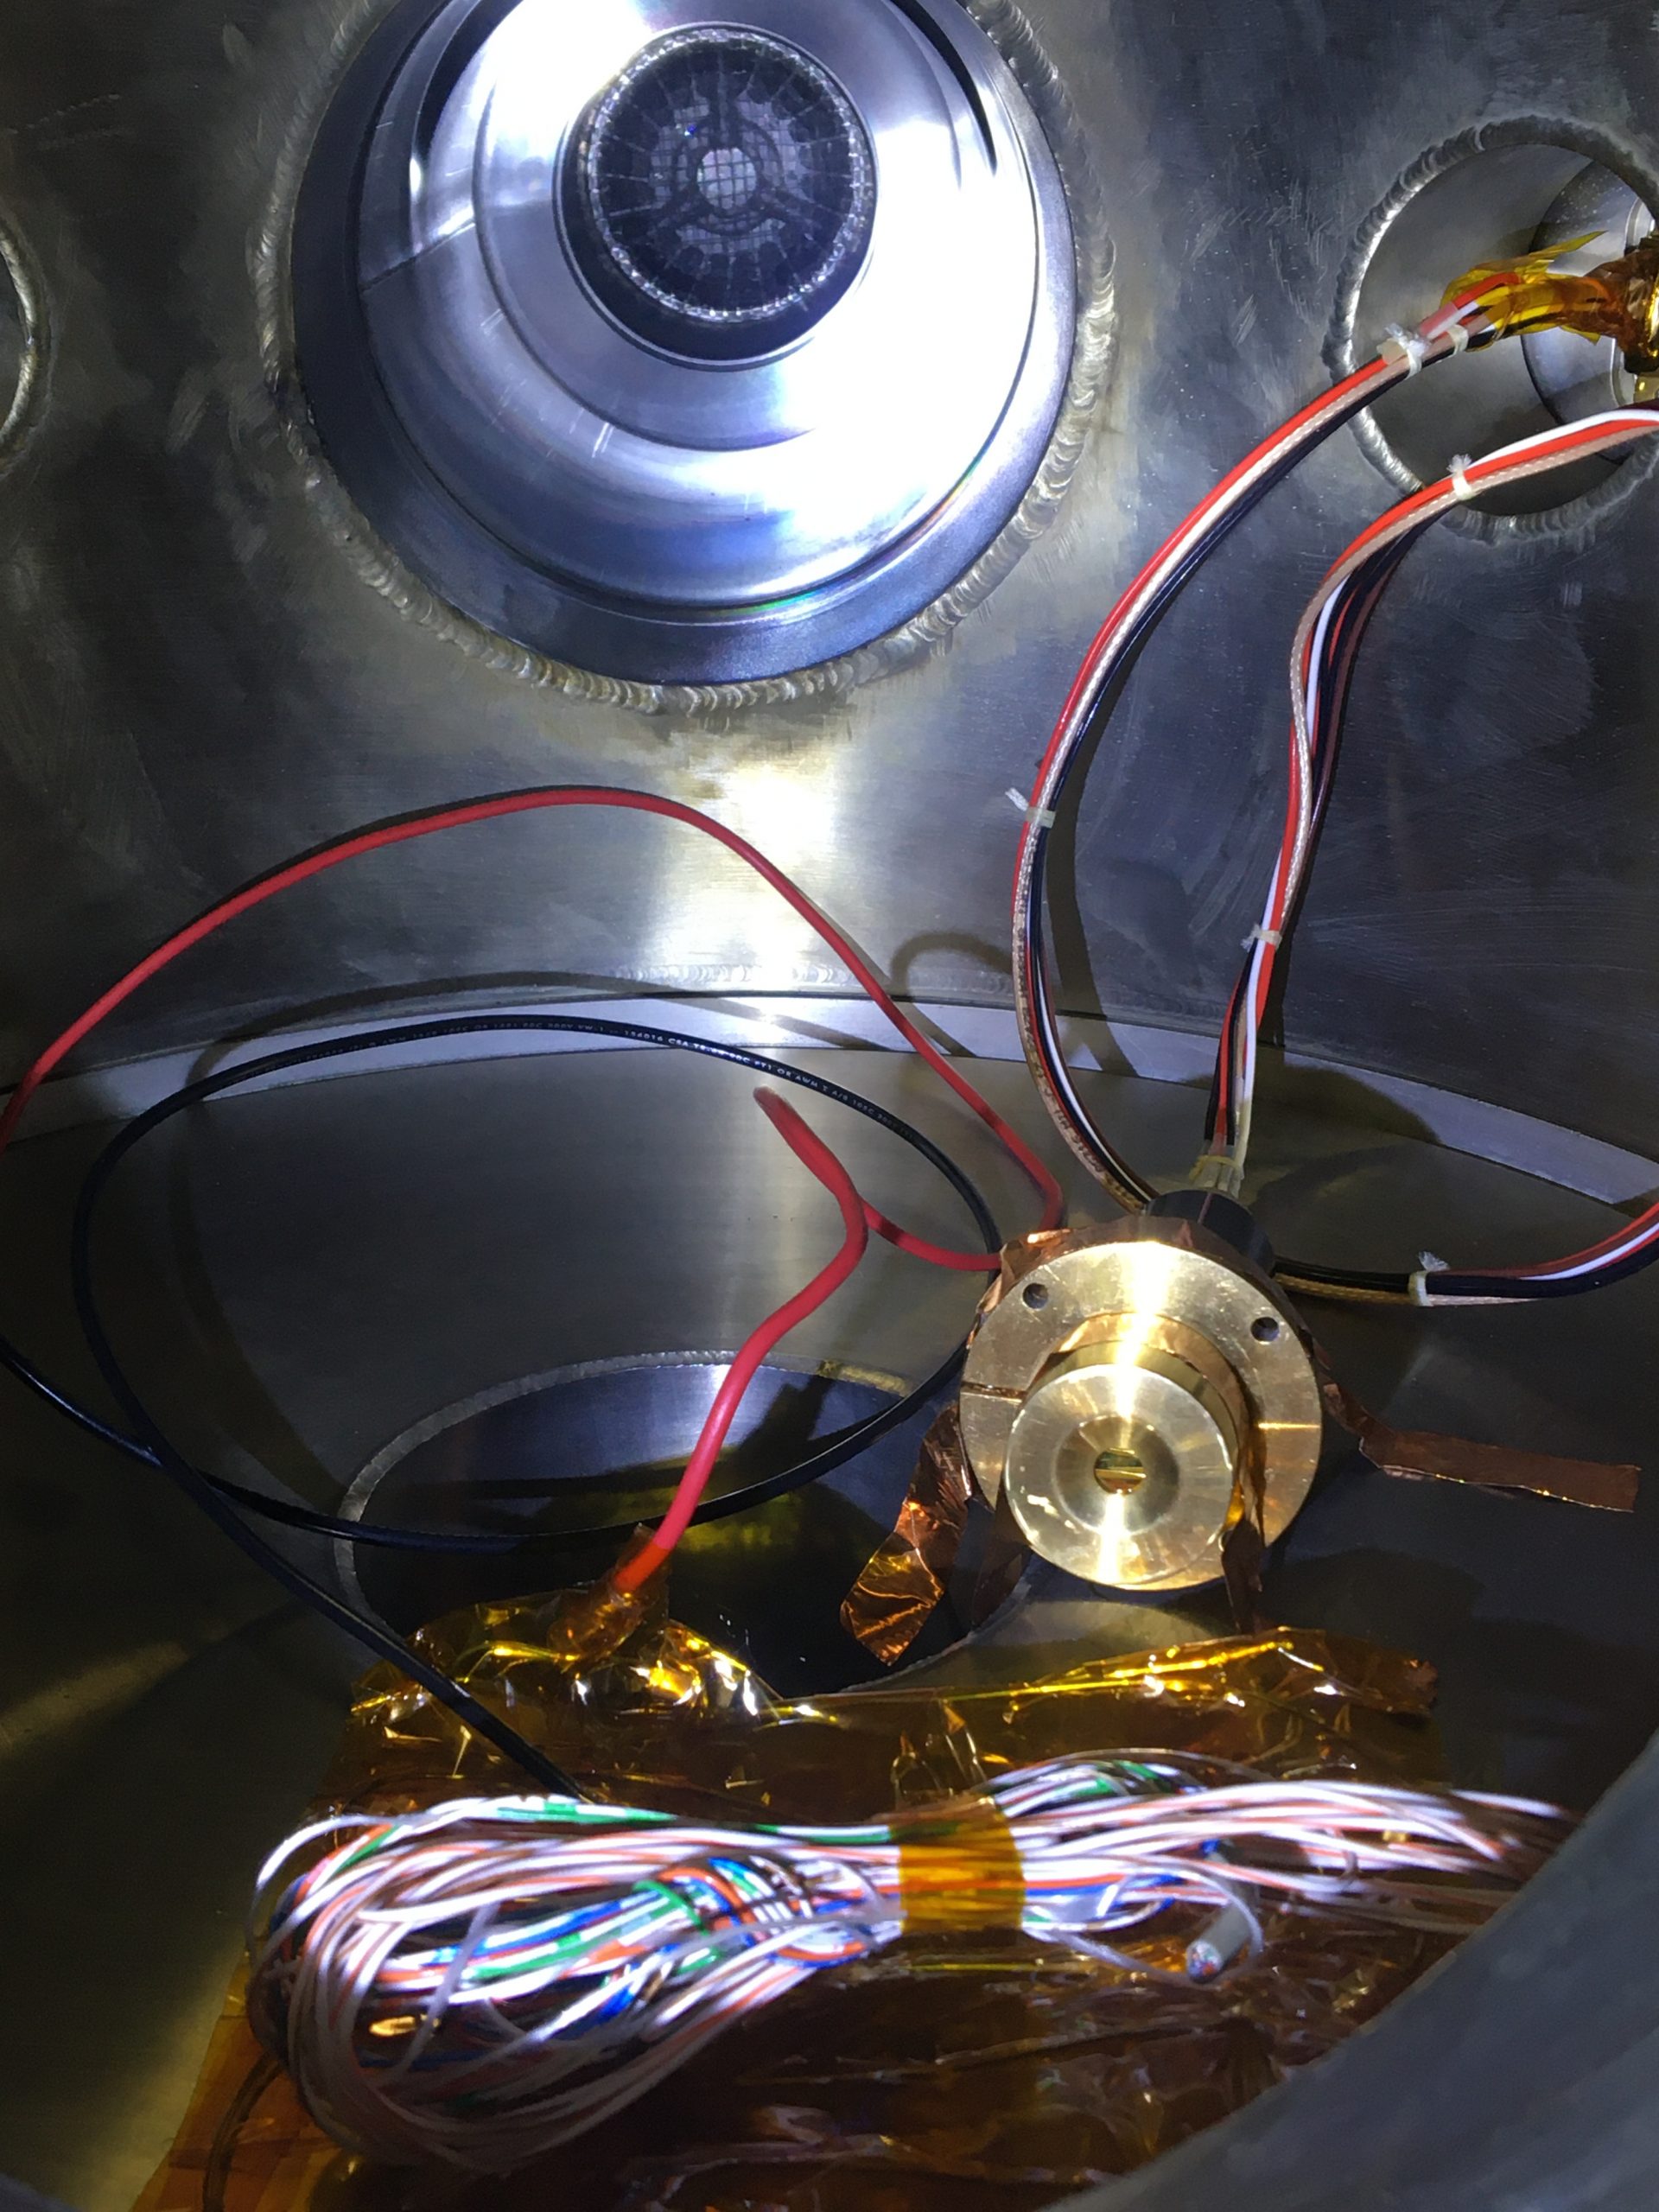
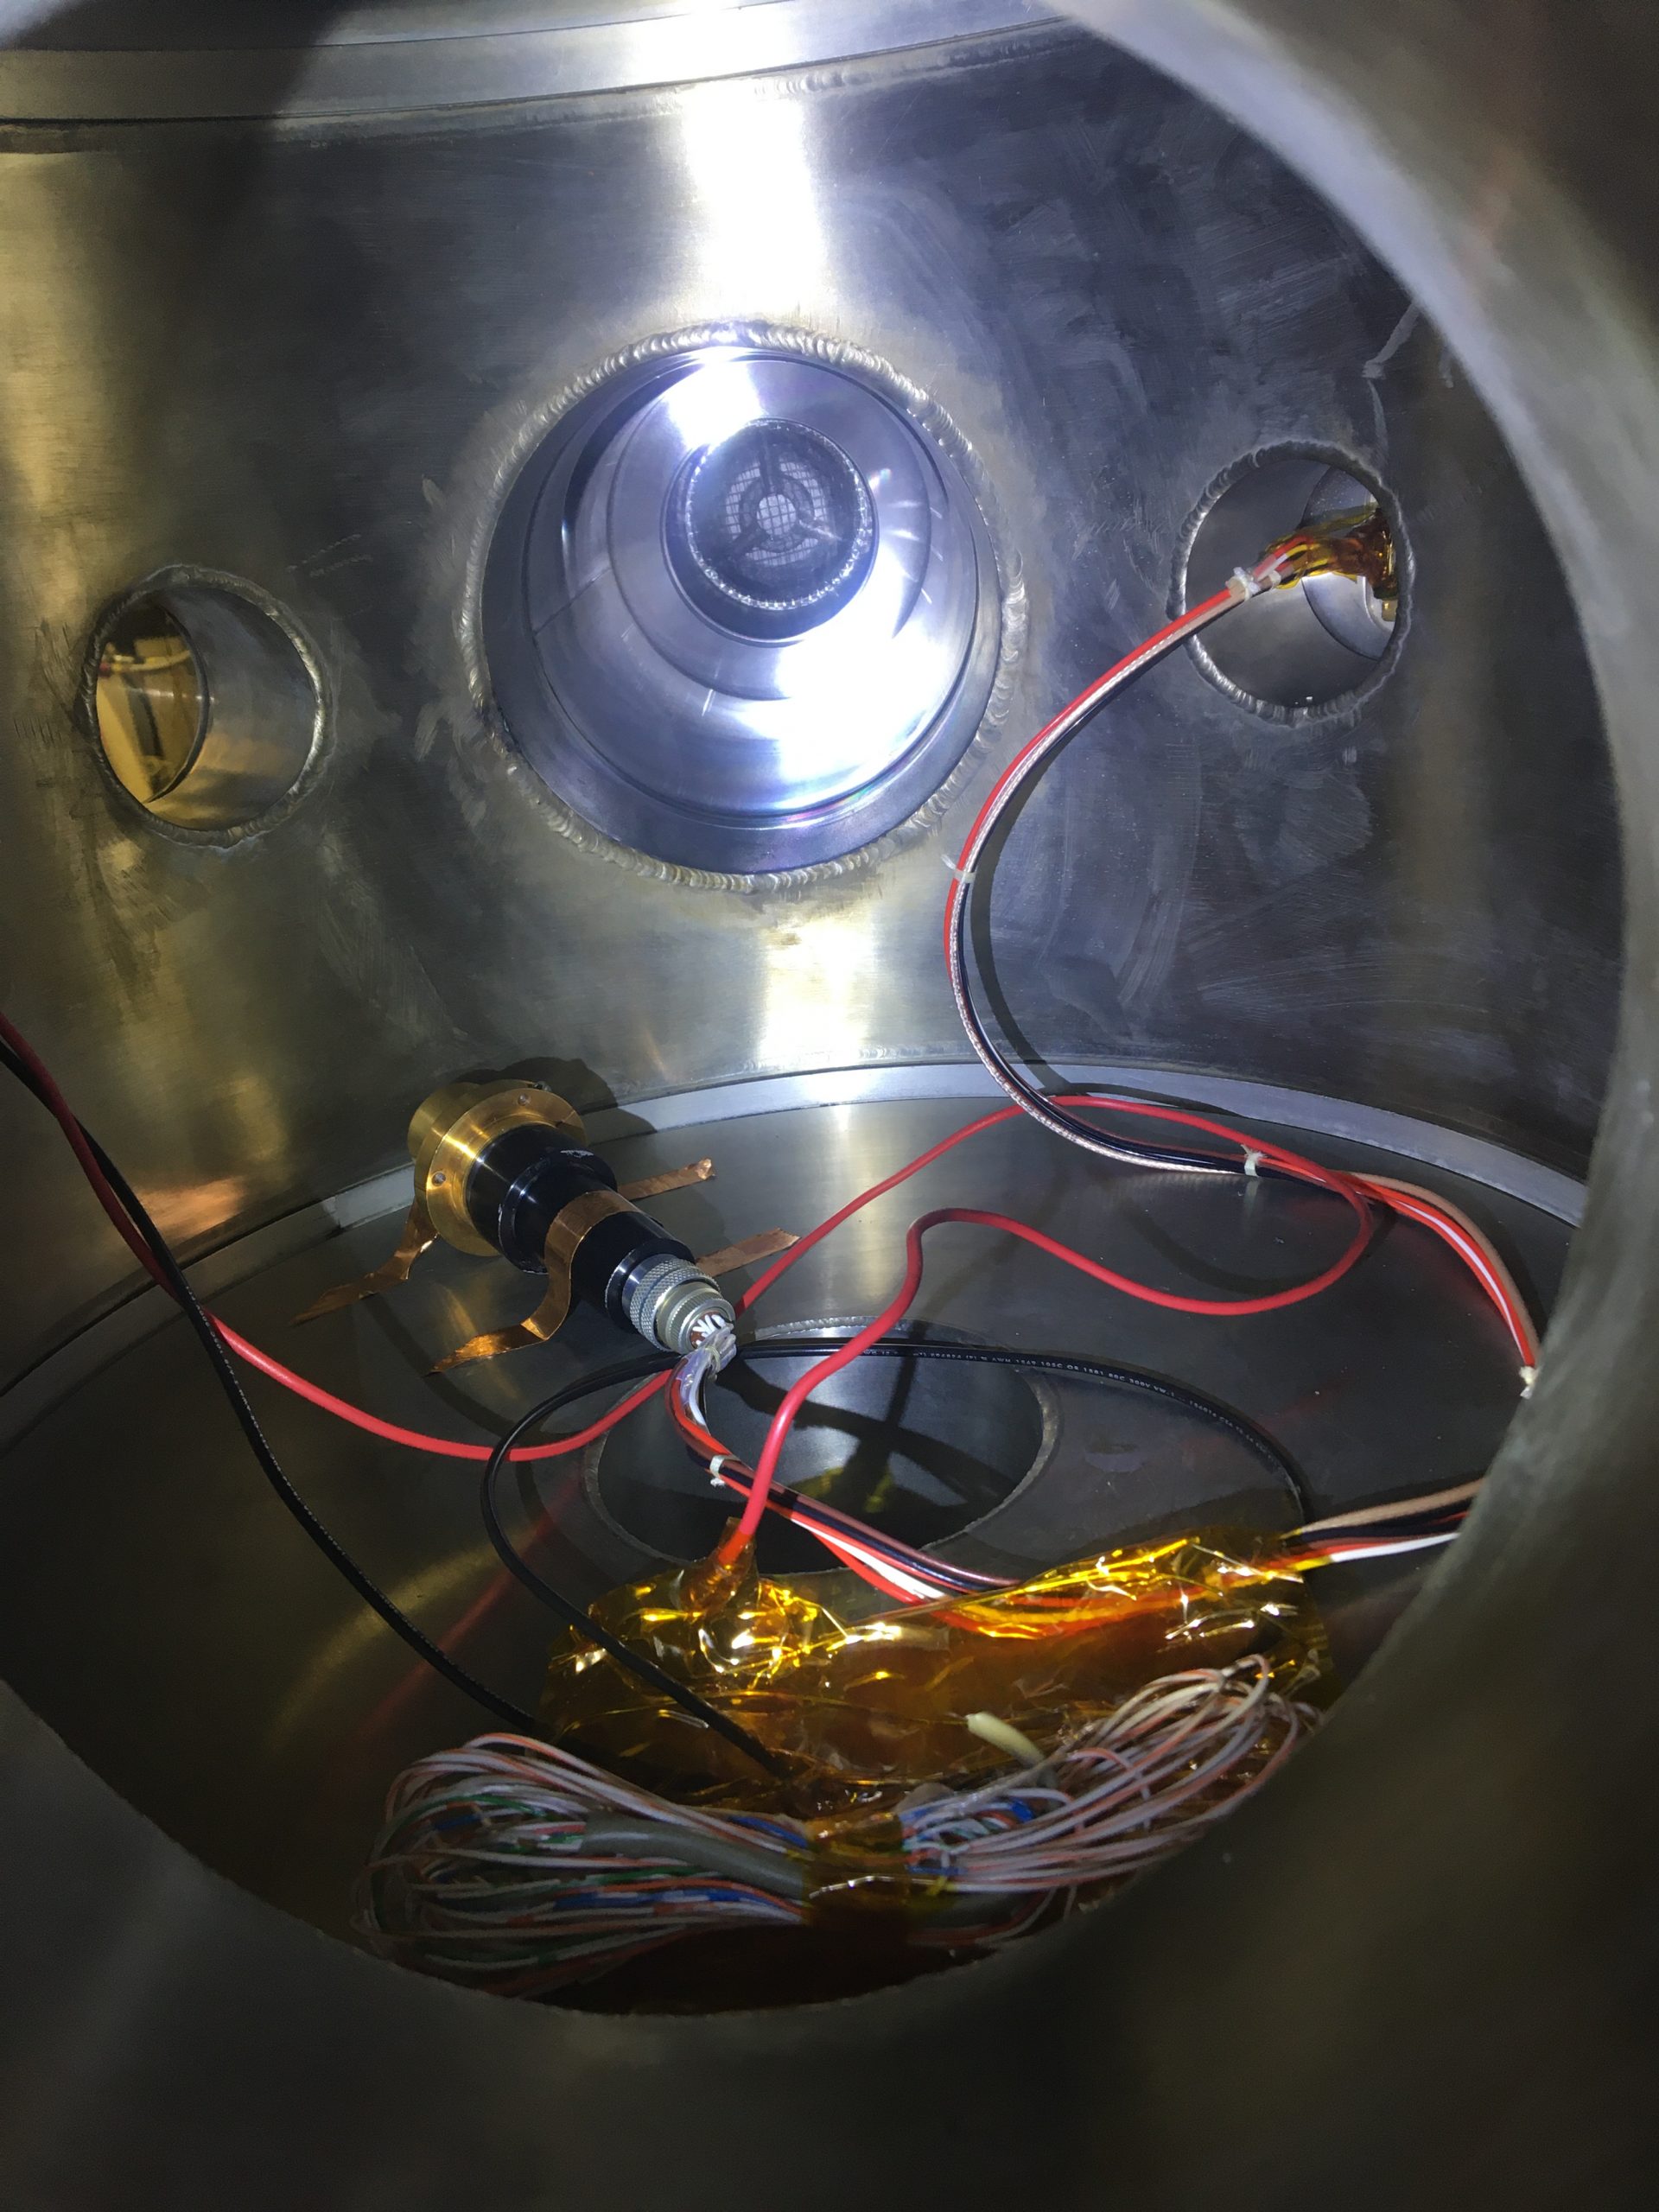
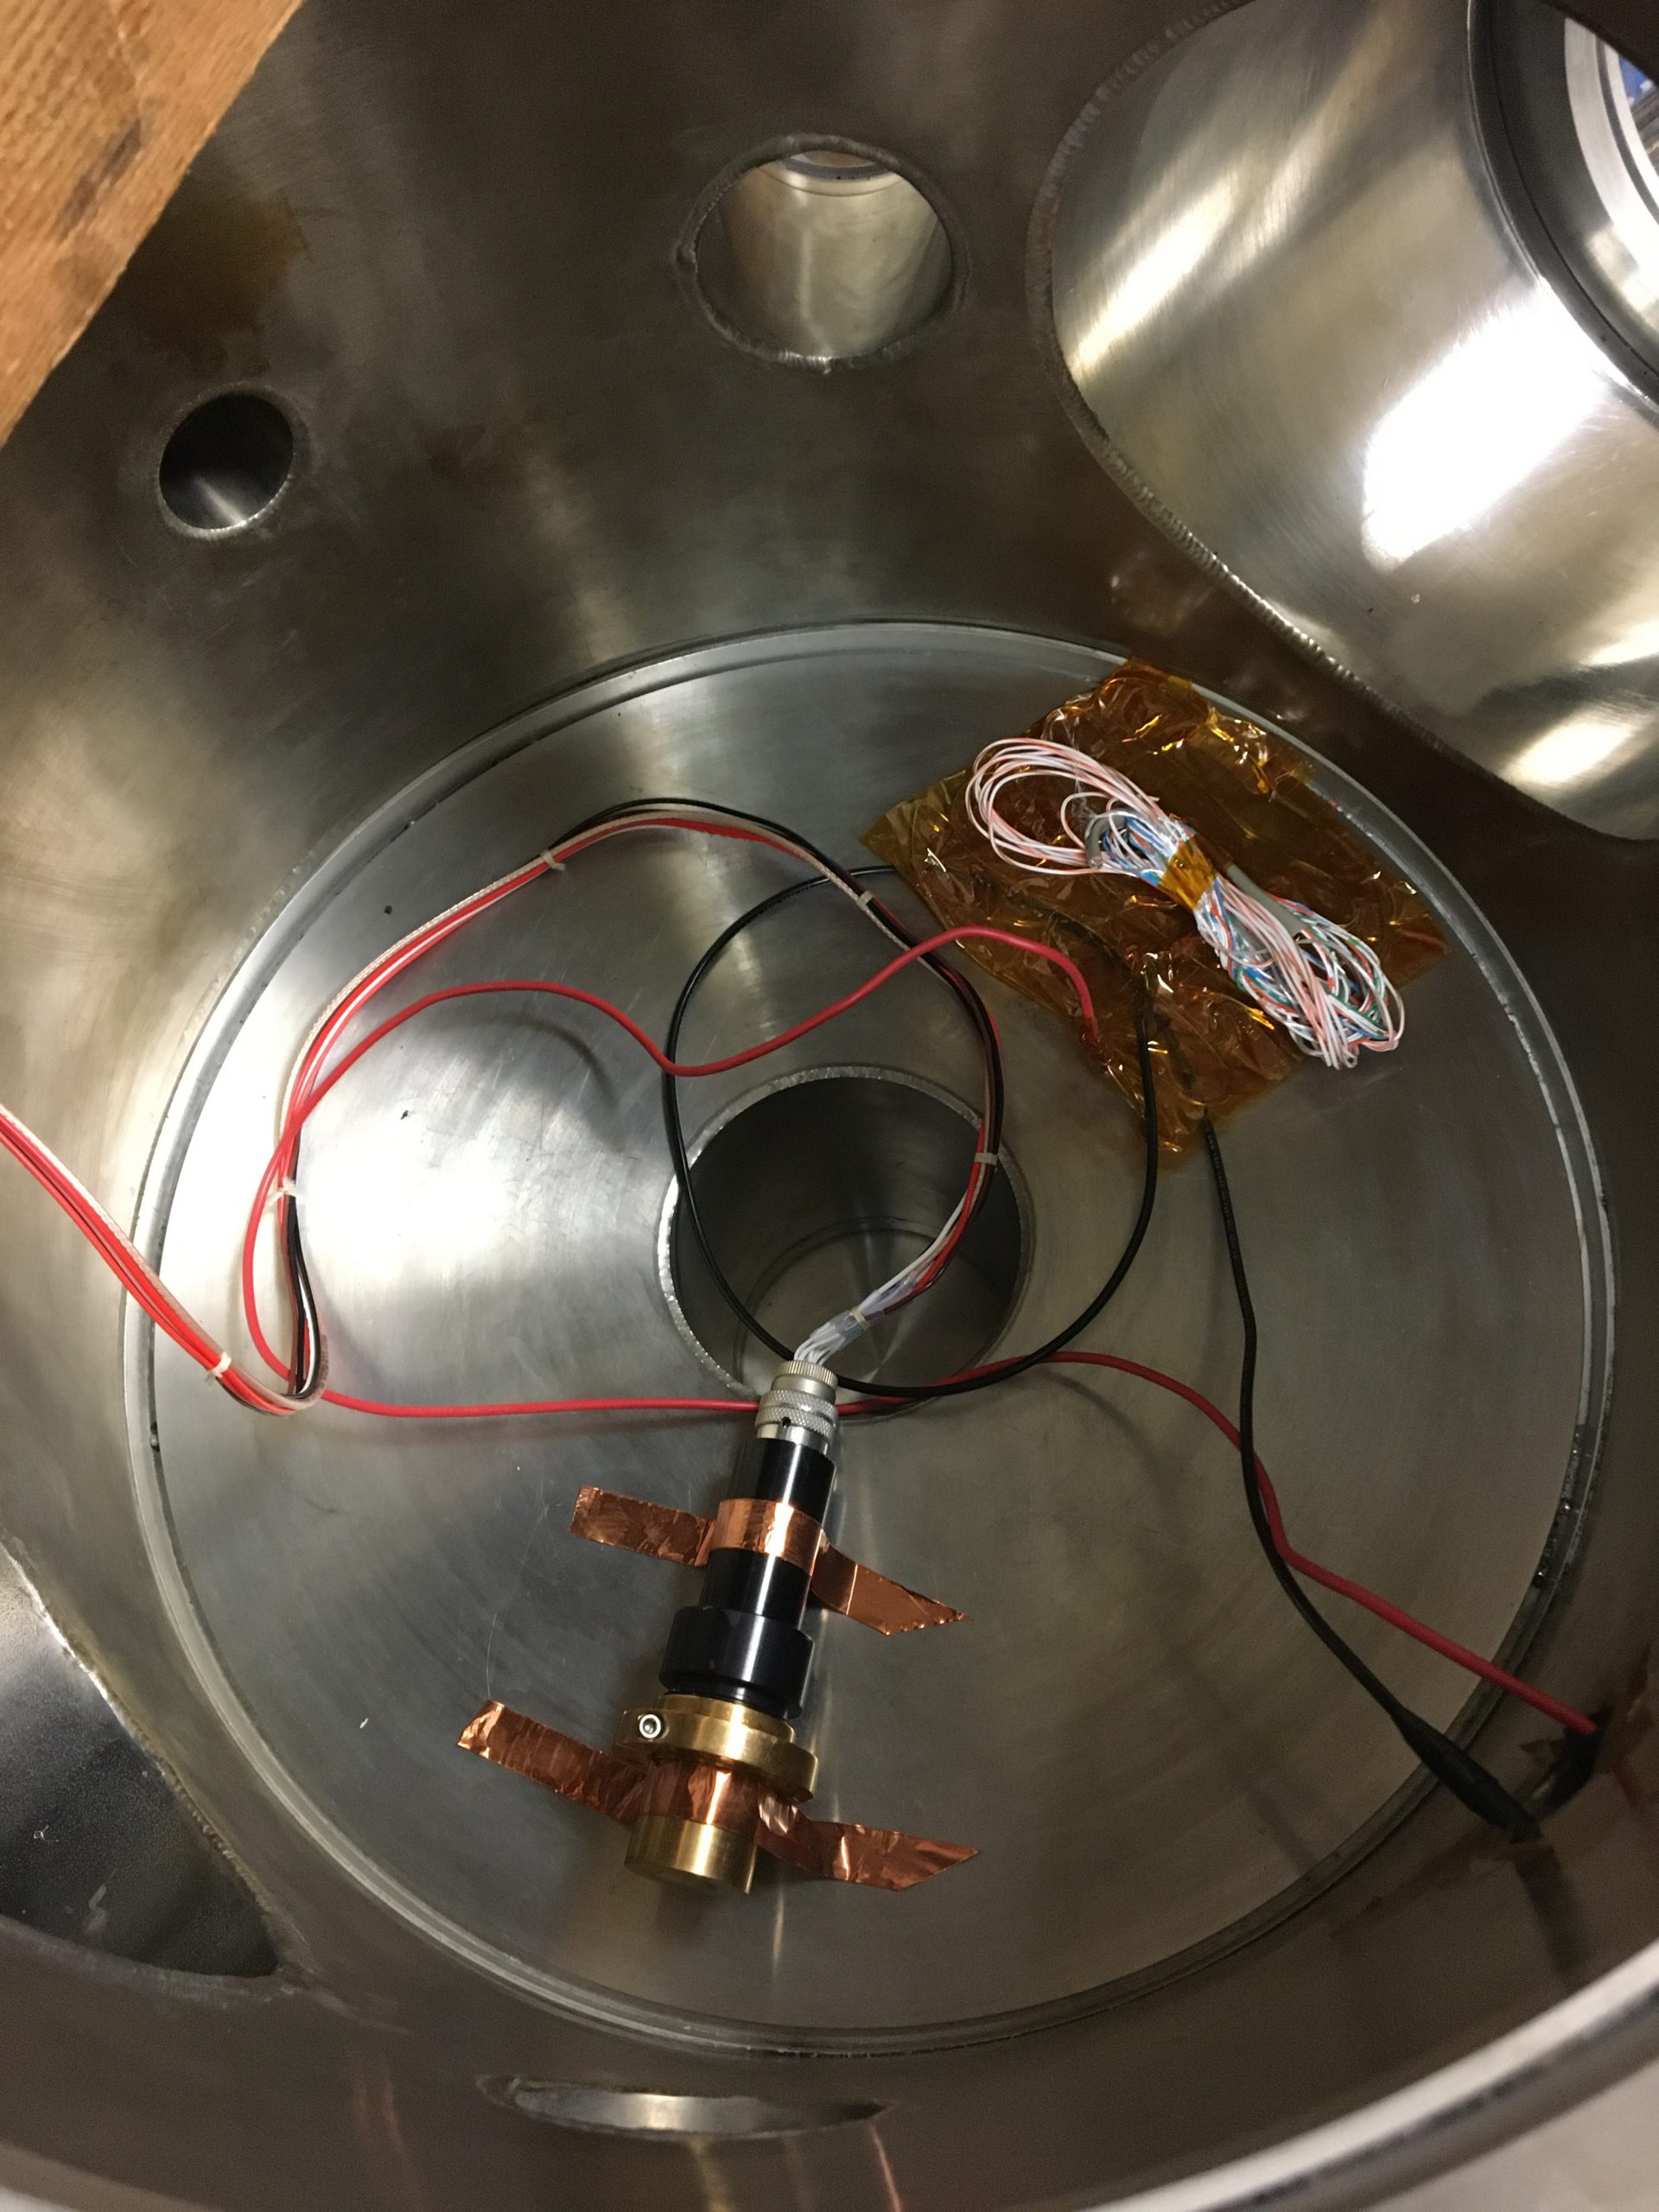
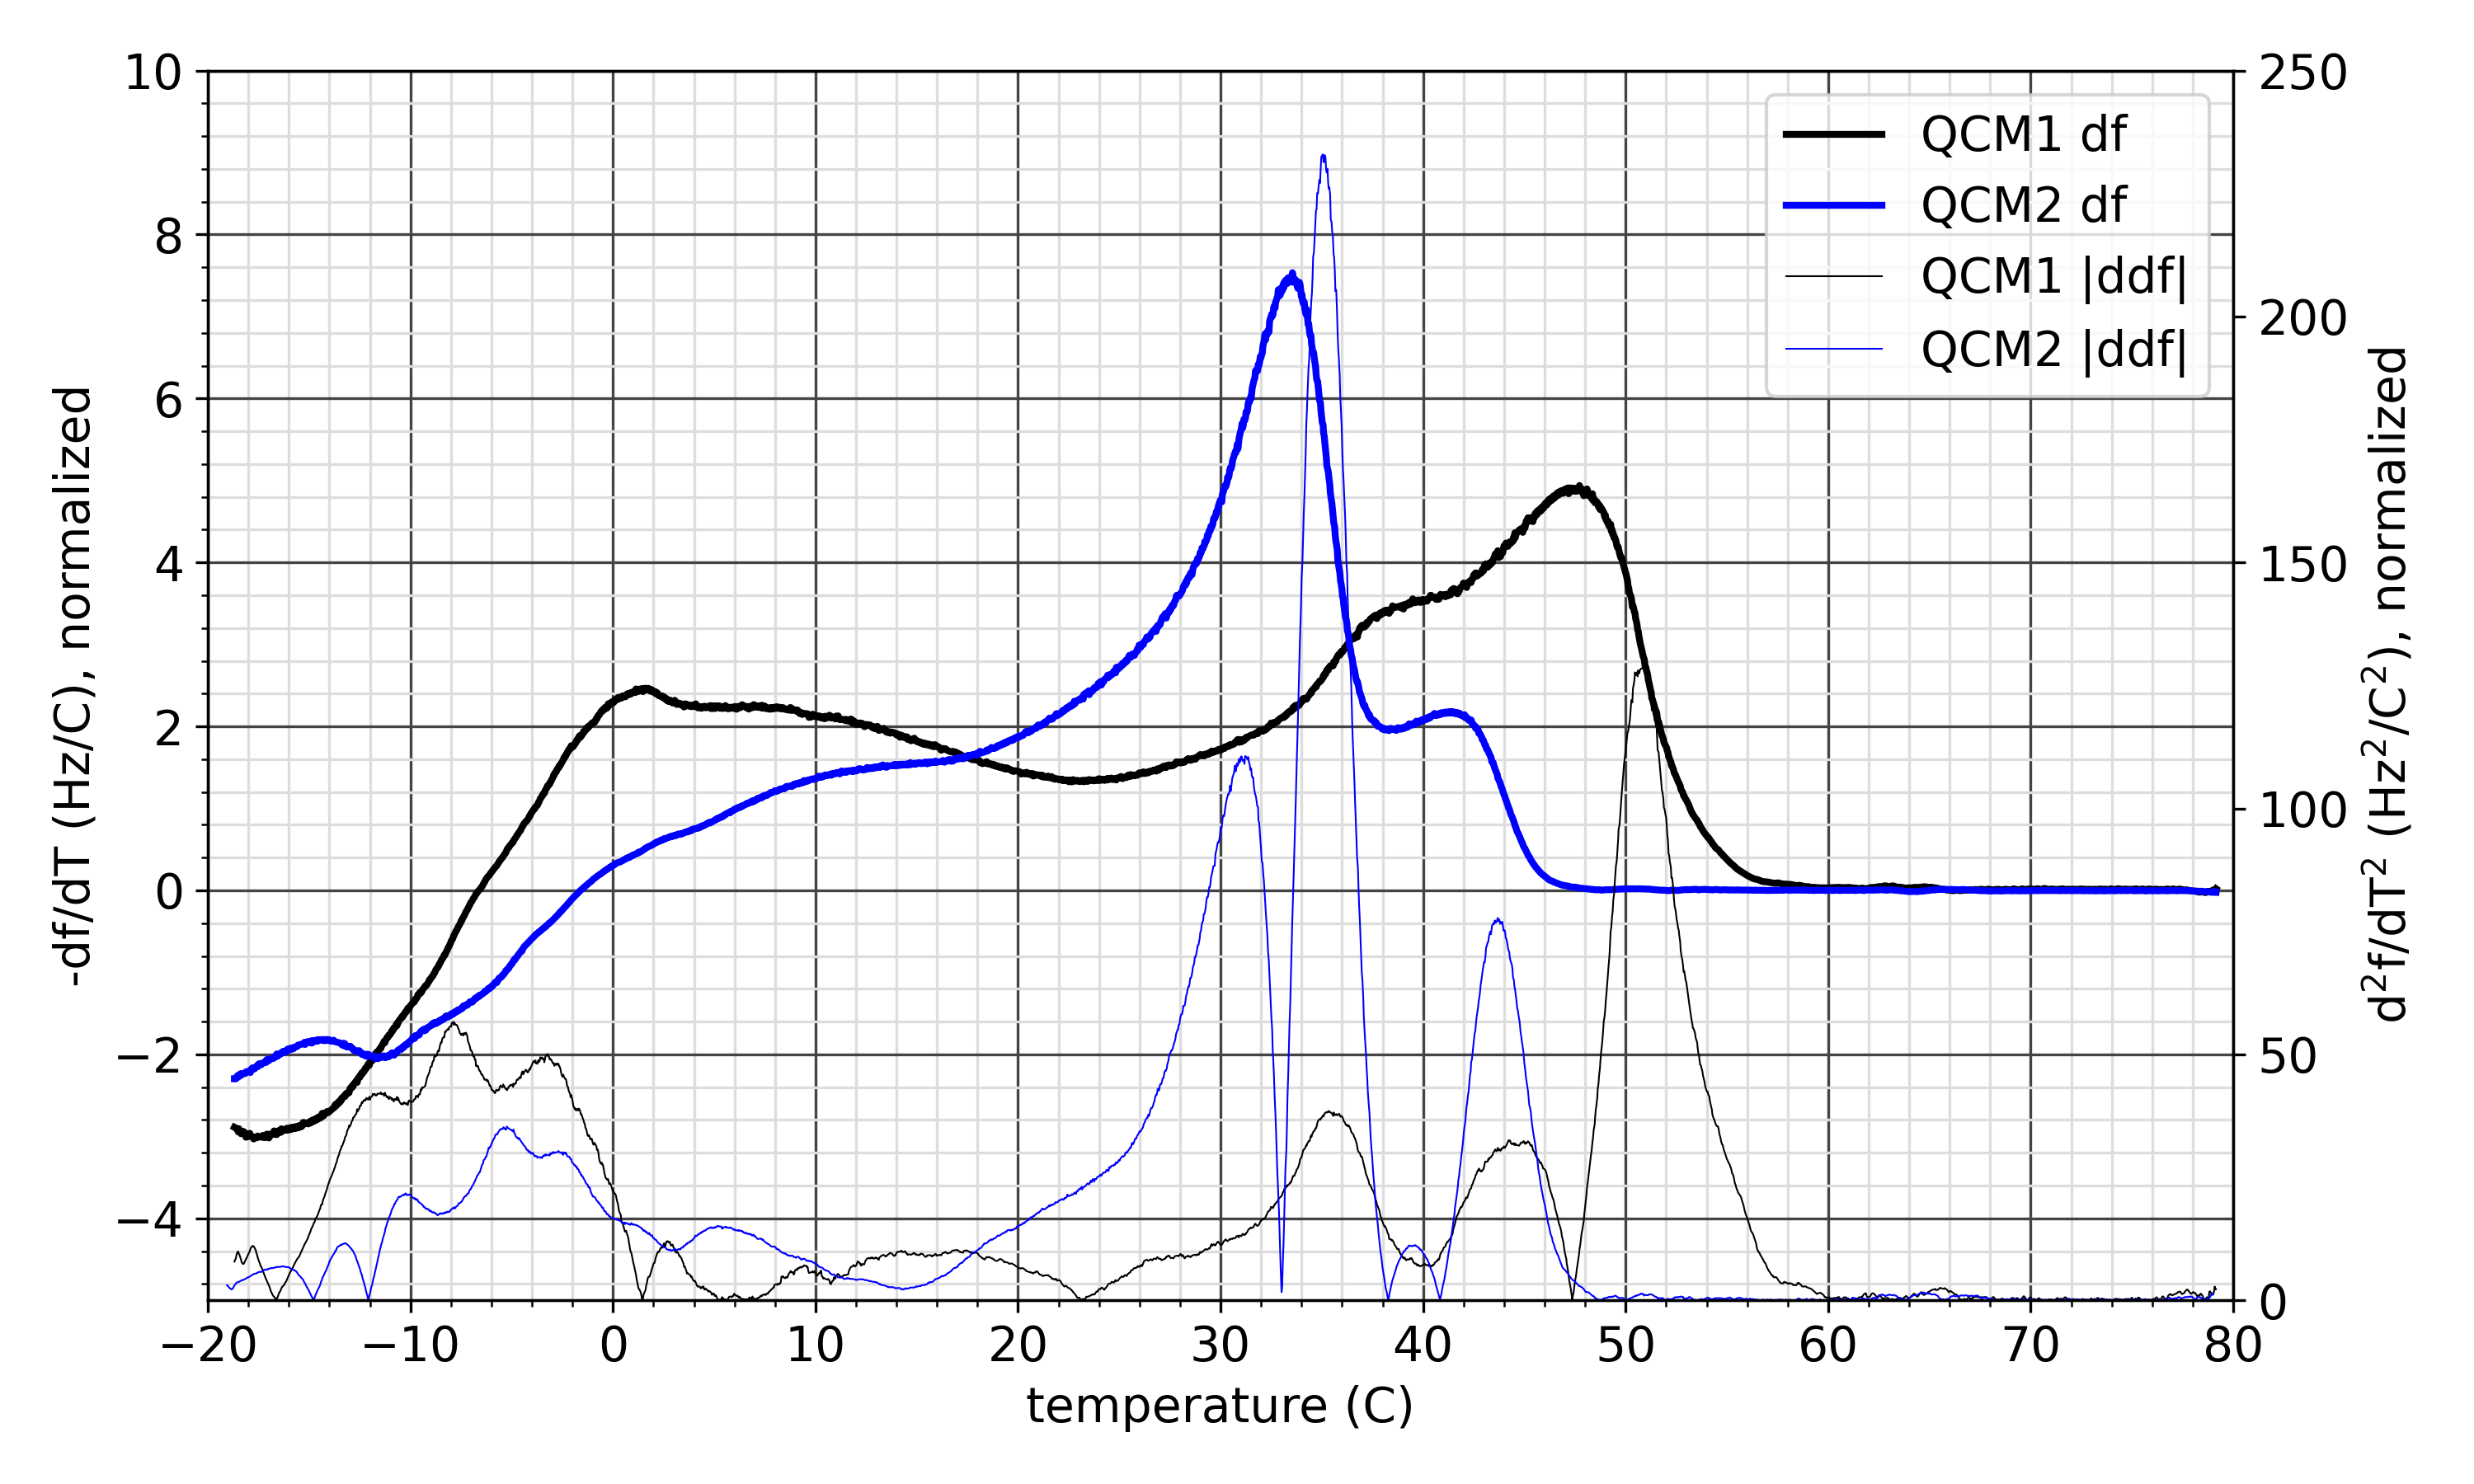
Figure 3 then visualizes the TGA collected using this setup. We performed three individual tests to demonstrate repeatability. The solid lines indicate the TGA from the QCM facing the sample in orientation 1, and the dashed lines are from orientation 2 with the QCM facing the wall. Test 3 seems to be out of family, for some undetermined reasons. However tests 1 and 2 indicate the expected behavior. The molecular population reaching the wall facing QCM has the high temperature component cut off. This is the population sticking to the walls.
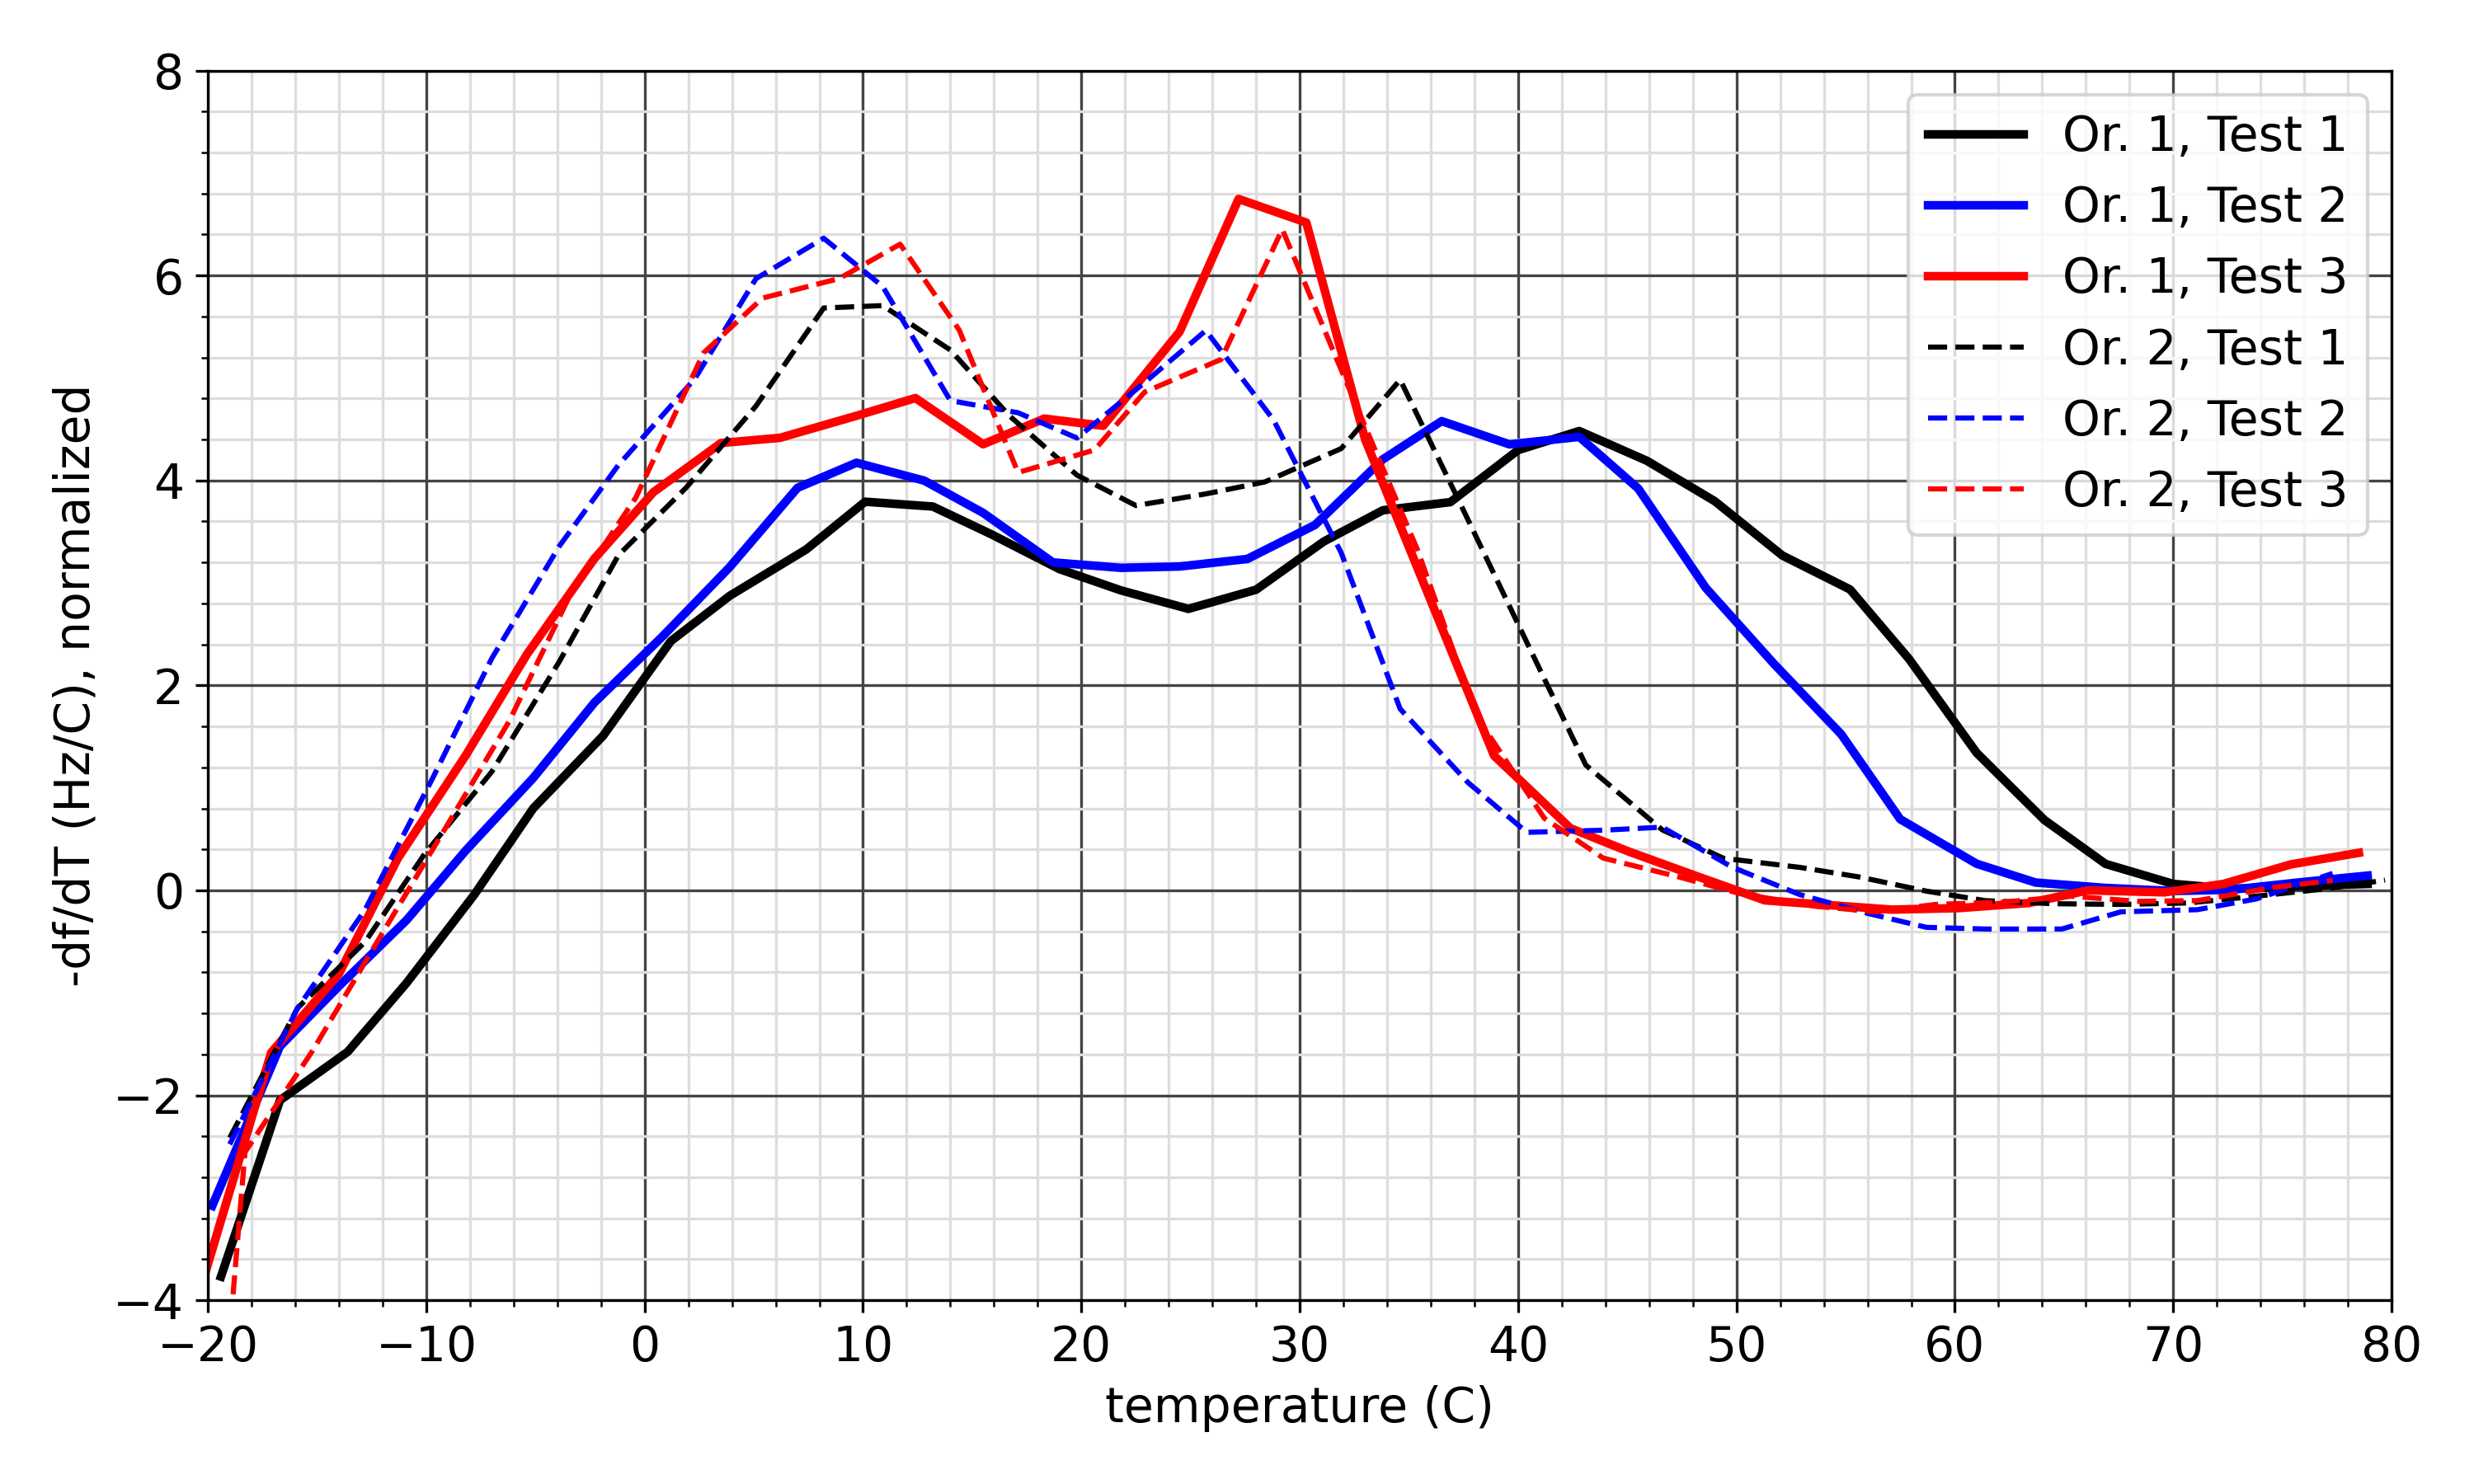
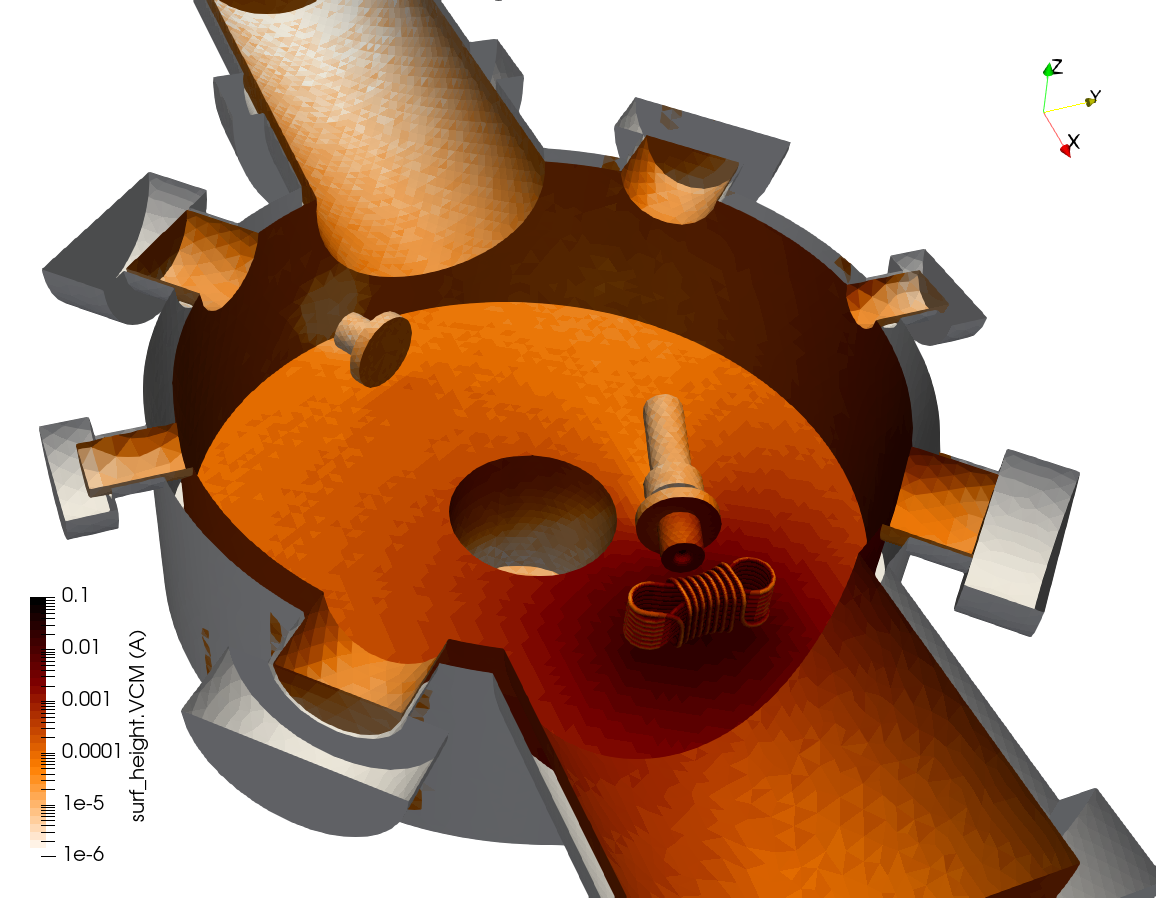
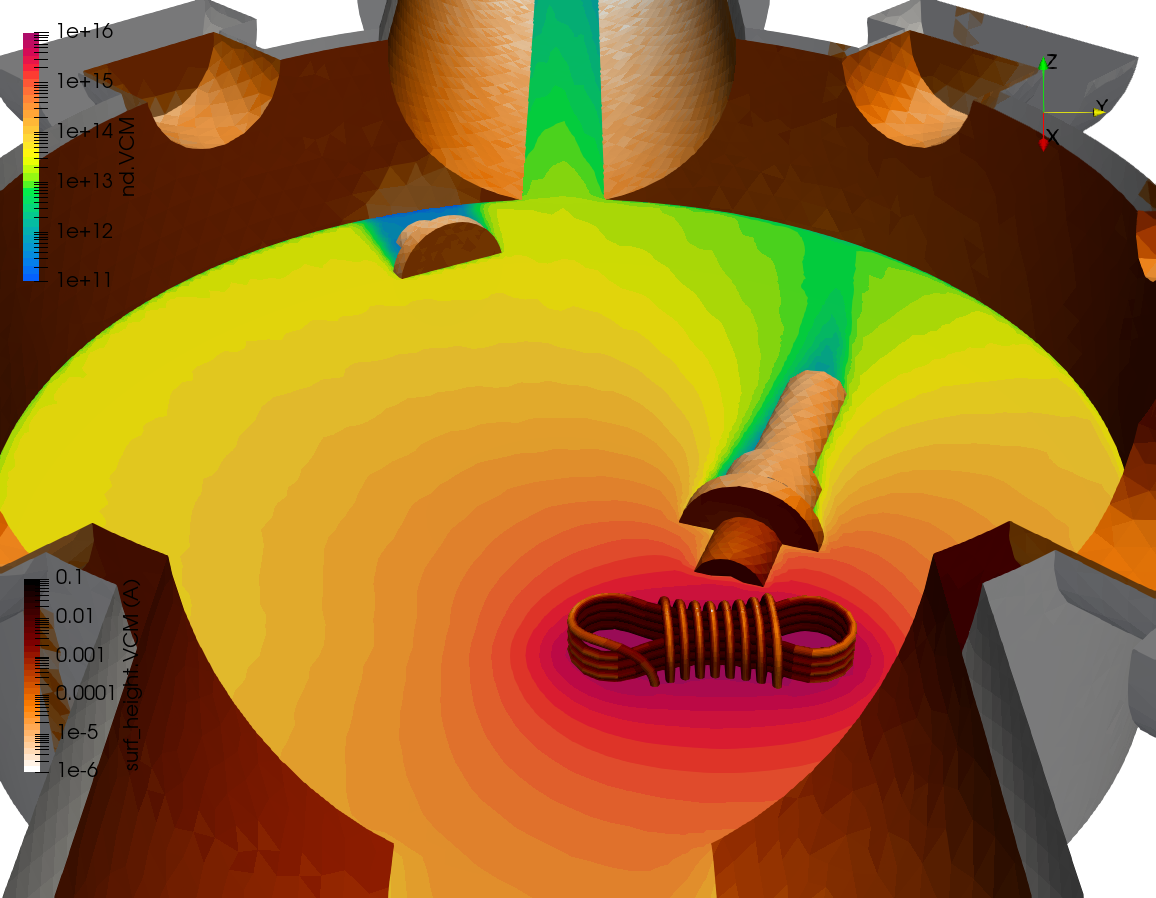
Figure 4 then visualizes the numerical results we were able to obtain by replicating this experiment in CTSP. Here we assumed the presence of the second QCM. The first pictures shows the expected surface contaminant deposition thickness. The second pictures also plots the volumetric contaminant concentration. The mass deposited onto the surface zone corresponding to the QCM crystal was used to extract the mass deposition rate. It was compared against the experimental data. As expected, we found the two values to disagree. The simulated deposition was found to be 4431 times smaller than what was observed experimentally. For the utilizing sticking coefficient and wall temperature, this reduction corresponded to 15.9 wall bounces, which seems reasonable. Again, this disagreement arises from the sticking coefficient model reducing flux on each wall impact, while in reality, the reduction is expected only on the first bounce. The remaining molecules are then expected to bounce around the chamber, until eventually finding the much colder QCM crystal (or the pump).
Blue Origin
Figure 5 shows the analogous setup at Blue Origin’s Kent, WA facility. Both myself and Elana had a chance to travel to Washington state to support this experiment. Here the sample was placed on a scaffolding with QCM 1 placed below it. QCM 2 was facing the chamber door. We started by utilizing a prebaked flight harness but the outgassing rate was too low to make it useful. Subsequently an unbaked electrical cord was used. This cable on the other hand outgassed too much, limiting us to only short data collection periods to avoid saturating the QCM crystal.
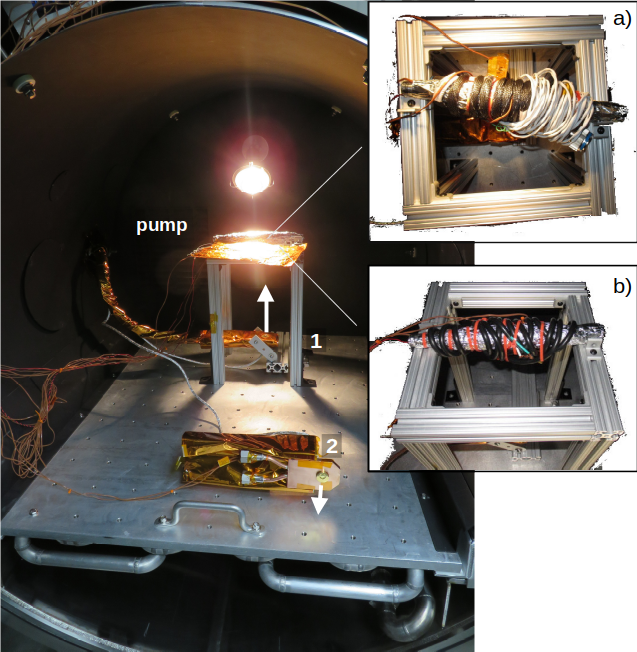
Figure 6 then visualizes the QCM data taken at Blue Origin for the unbaked electrical cable. As can be seen, the collection period (with the crystal temperature, dashed lines, low) is shorter than the TGA (temperature increasing) due to the high outgassing rate. This likely introduced an error in the TGA measurements as the incident flux could not be discounted.
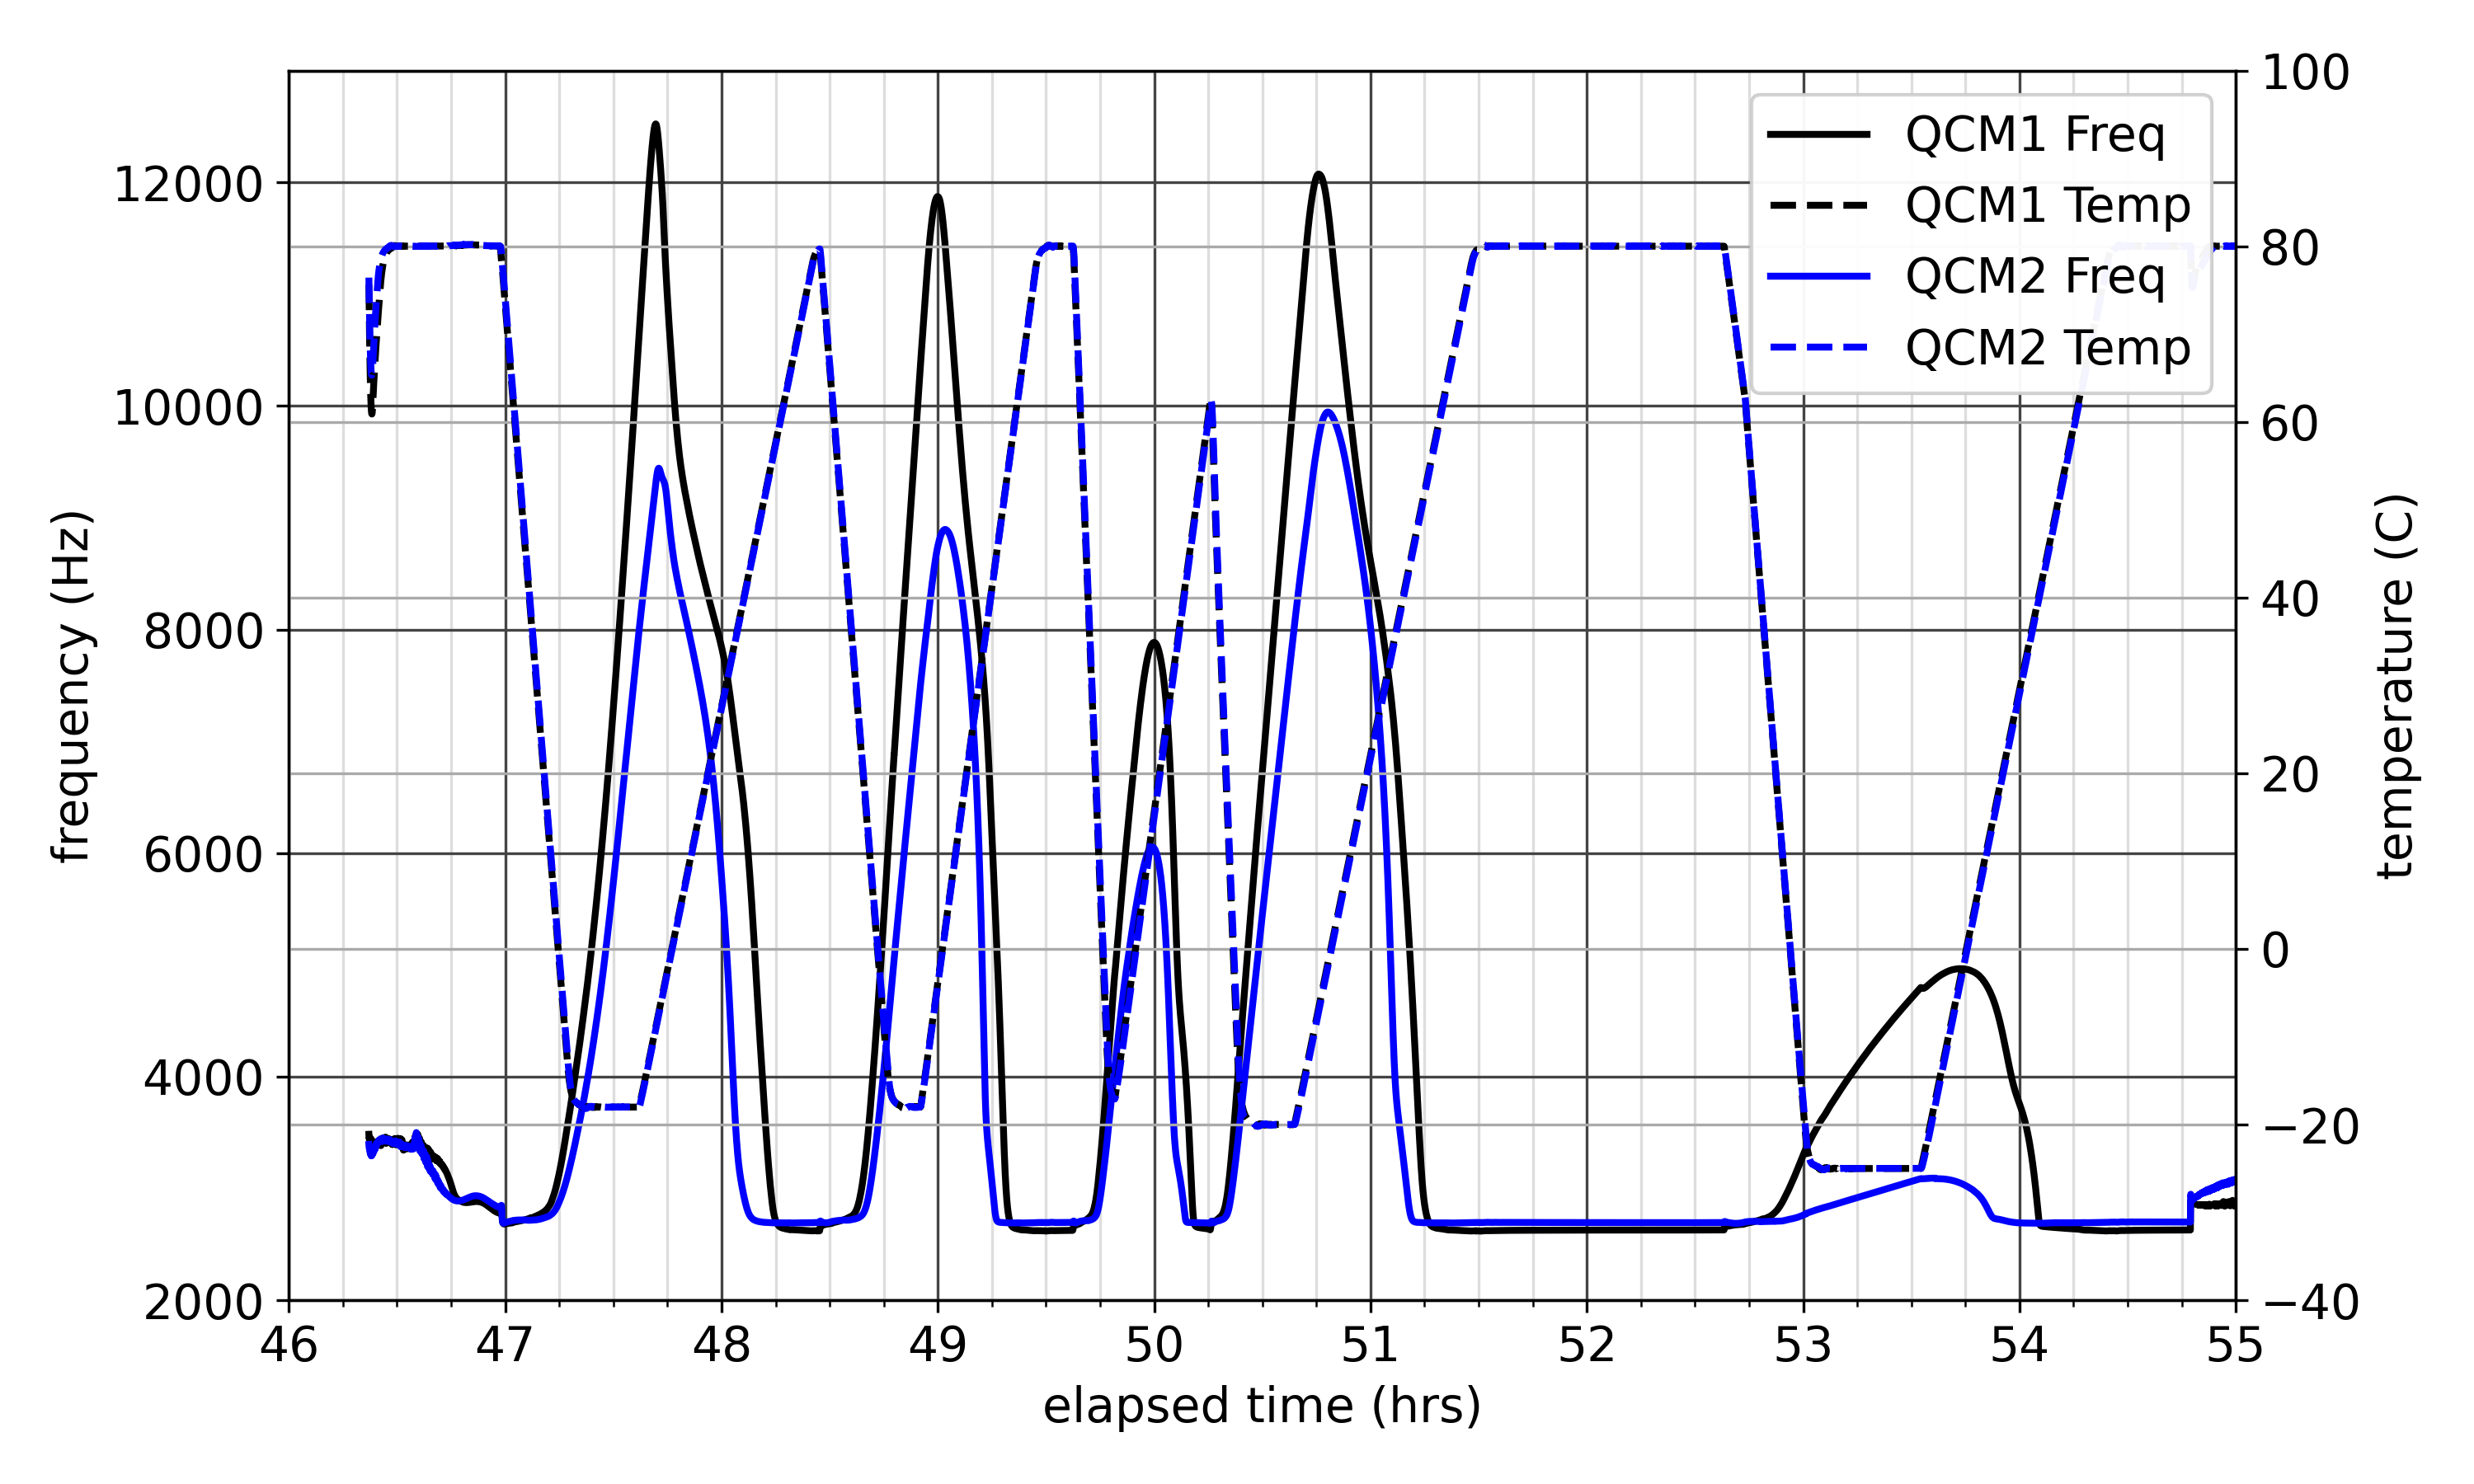
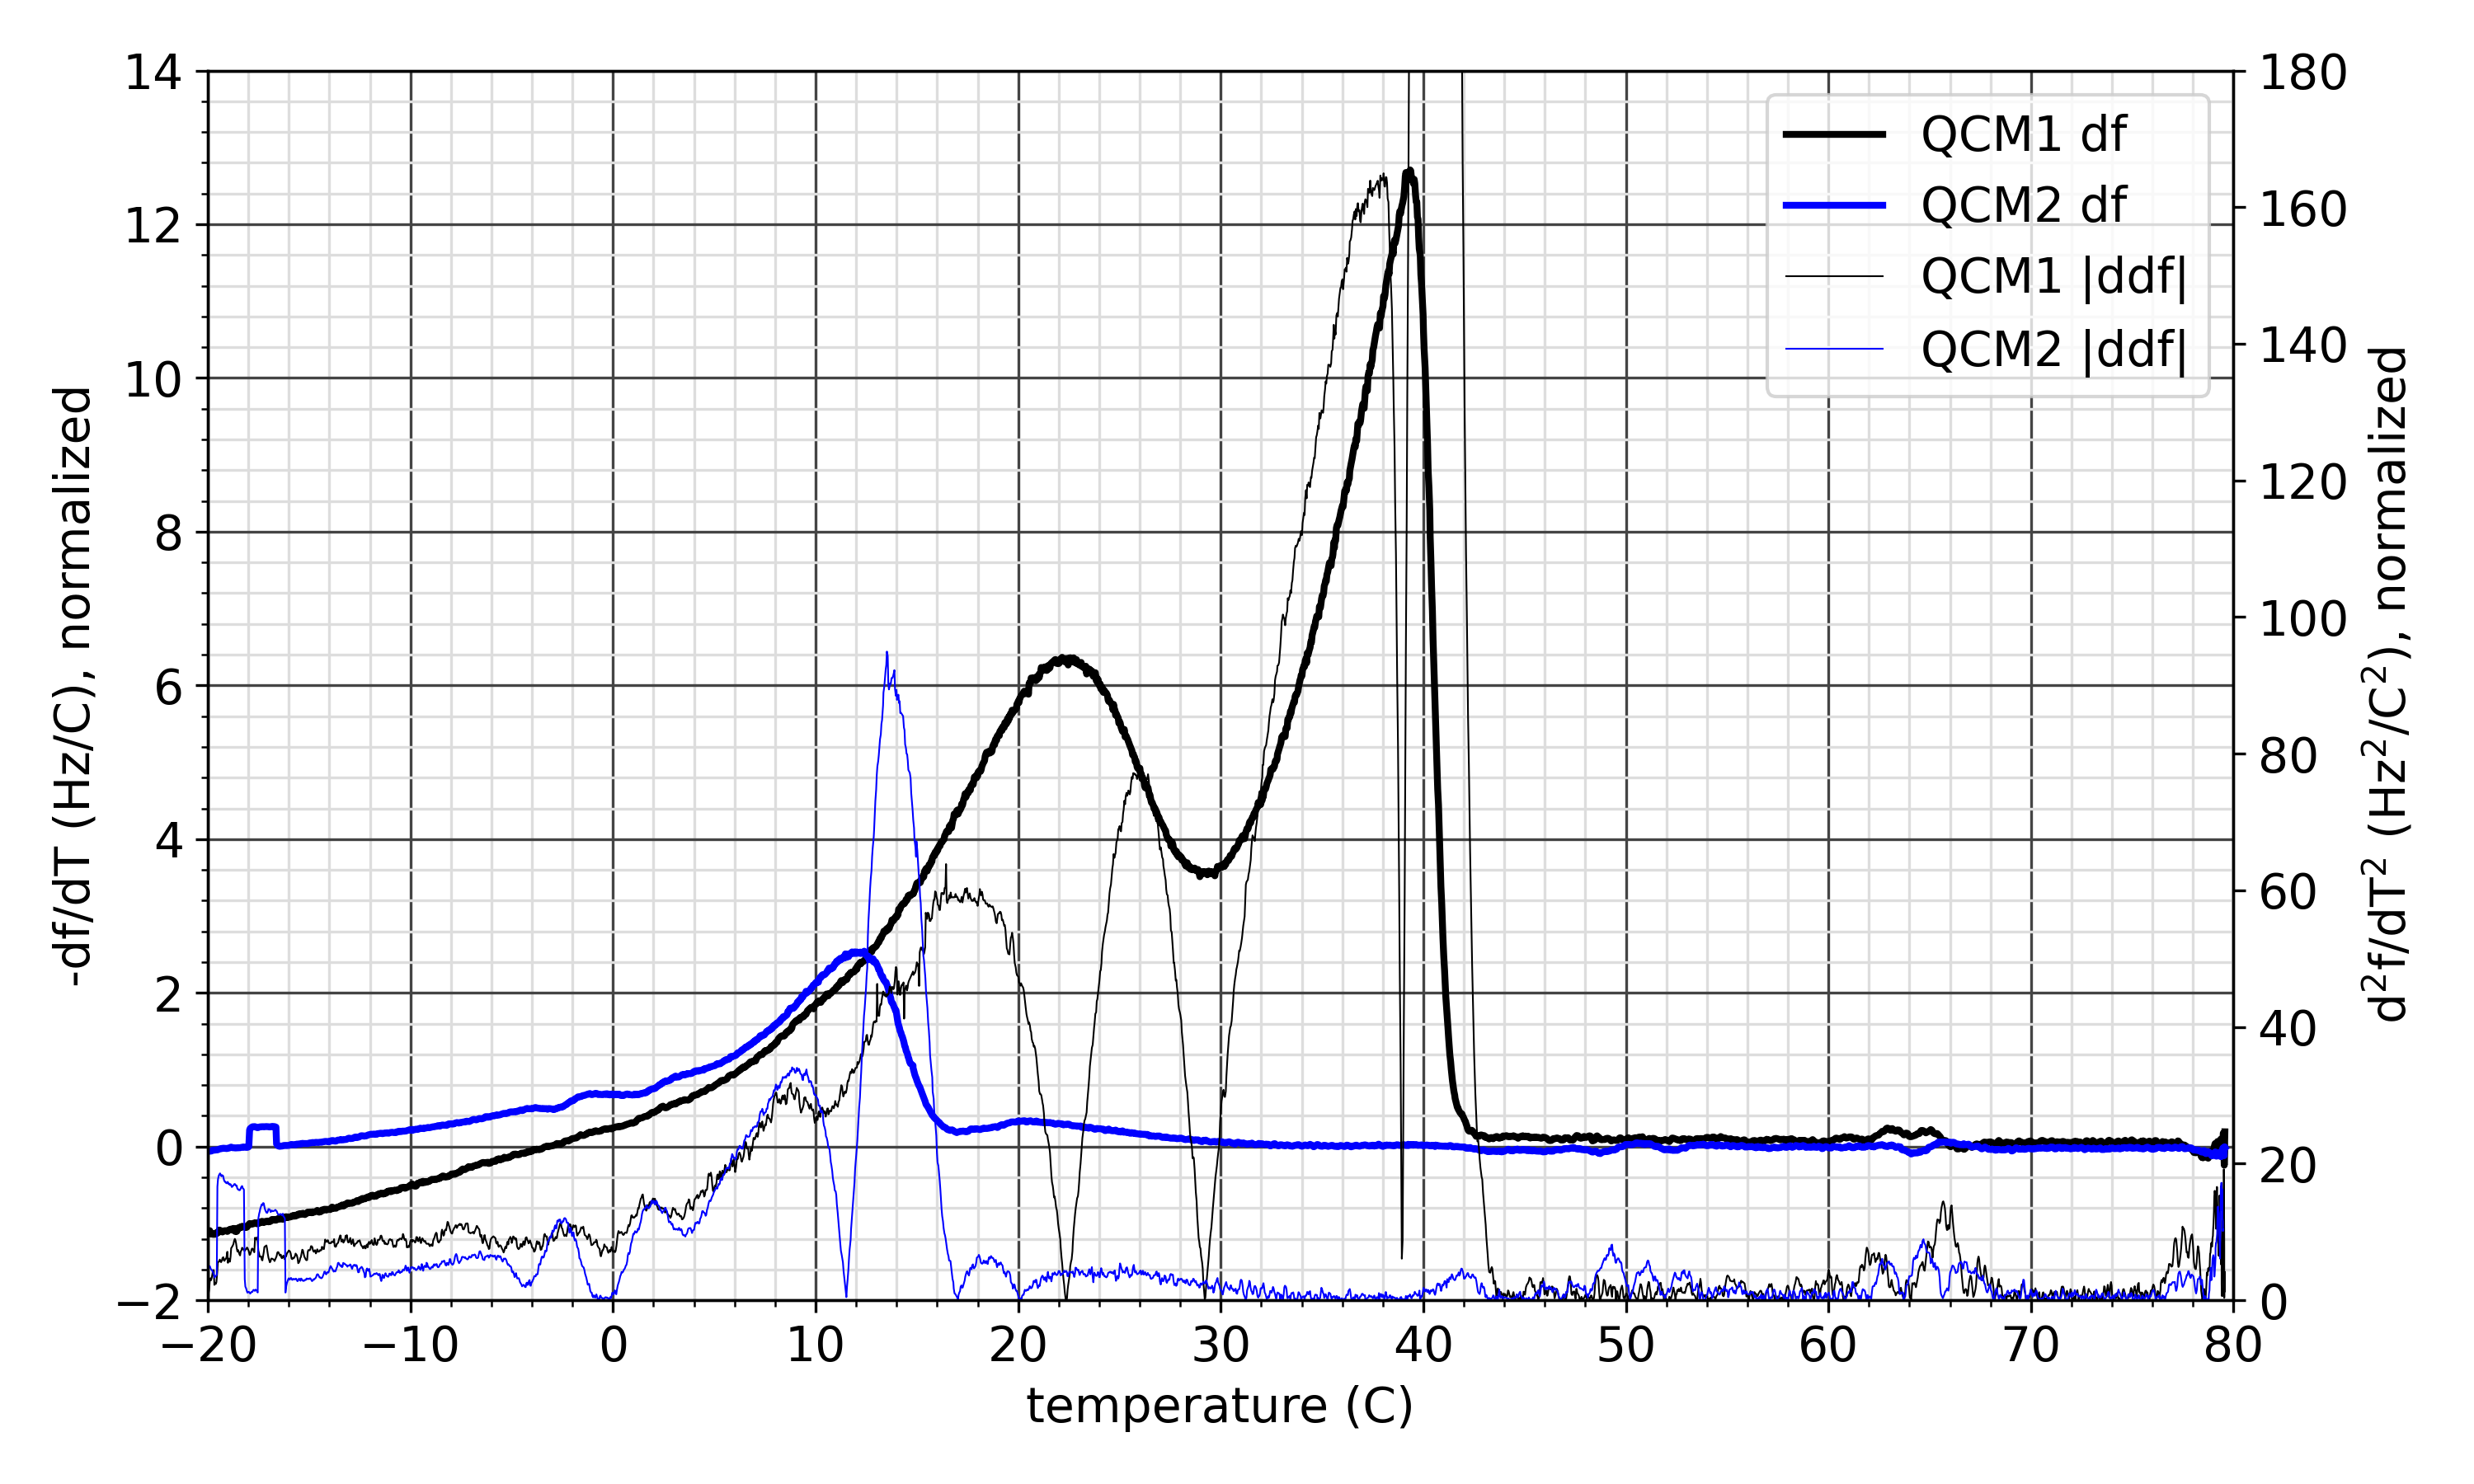
Next, Figure 7 plots two different TGAs corresponding to hours 50.56 to 51.48 and 53.56 to 54.43 in Figure 6. While both demonstrate a clear cut off of the high temperature component, there is also a clear variation in the collected traces. Data collection for contamination analysis is not easy!
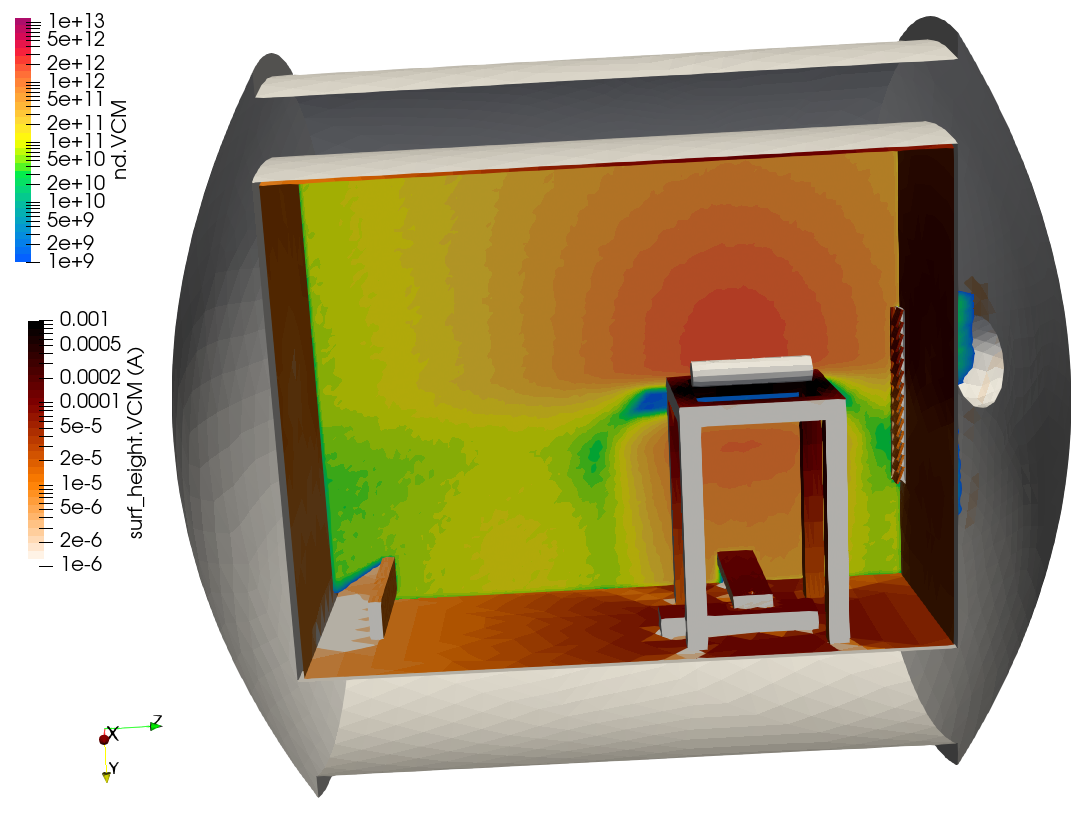
Finally, Figure 8 visualizes the companion numerical simulations. Both surface deposition and volumetric contaminant concentrations are shown. The shadowing of QCM 2 body is also seen. Similarly to the results from USC, here we found that the numerical deposition on QCM 2 underpredicted the experiment by a factor of 17.6 times for the warm wall configurations which for the utilized sticking coefficient model translated to about 7.7 wall collisions.
As these experiments showed, modeling gray-body contaminant mass transport is not trivial. Some researches have started implementing multi-species models, which although conceptually can correctly capture this behavior, are not easy to initialize. While dedicated mass spectroscopy equipment may be available for small material characterization experiments, it is not feasible to obtain mass spectrum at the spacecraft level as the trace contaminant species are easily overwhelmed by the much denser atmospheric background. Thus, we envision that the future work will involve some combination of experiments and numerical modeling (perhaps with the help of machine learning) to automatically decompose the collected TGA signal into multiple mathematical contaminant species, each with a different surface deposition behavior.