CAD Based Particle Simulation Code

In 2022, PIC-C received a NASA SBIR Phase I award to investigate the use of CAD geometries in particle-based gas kinetics simulations. We completed this study in January of 2023, and demonstrated that this is not only possible, but in many ways superior to the mesh-based status quo. I was assisted on this work by James Robertson who has since then started a PhD program at the USC Department of Astronautical Engineering. Although we were not successful in the Phase II submission (in part due to a lack of time to put together a decent proposal because of multiple concurrent deadlines), we are currently developing this technology further using internal funding. The work to date has been presented at the 2023 NASA Goddard Contamination Control Materials and Planetary Protection (CCMPP) Workshop as well as the 4th European Contamination Workshop in Toulouse, France. Future work will be be presented at 2024 International Electric Propulsion Conference (IEPC) and Rarefied Gas Dynamics (RGD) meetings. Please stop by if you will be in attendance.
The Challenge
Figure 1 illustrates the conceptual process for setting up and executing a gas dynamics simulation using SOA codes such as our kinetic Contamination Transport Simulation Program (CTSP). First, the analyst is provided a CAD model of the design geometry. Next, this model is run through a meshing tool to generate a triangular or a quadrilateral representation of the surface. The surface elements are then (manually) organized into groups used to assign material properties or attachment points for mass injection sources. An input file is then setup that makes use of these groups and notionally also loads other environmental information, such as surface temperature variation. The simulation is then run and the produced output files are visualized to be included in a report.
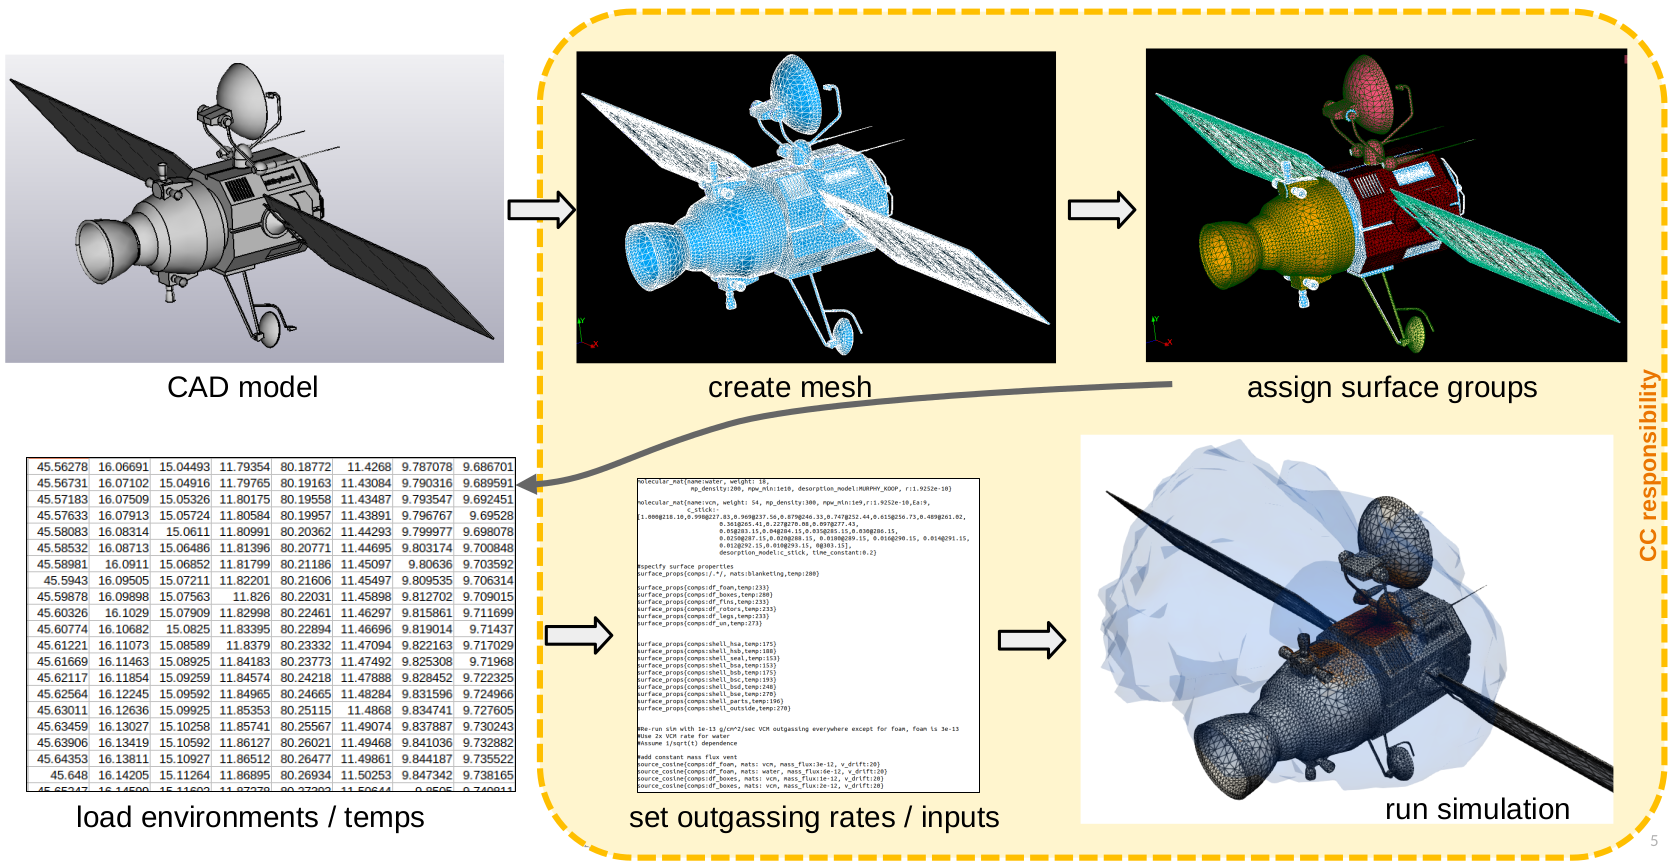
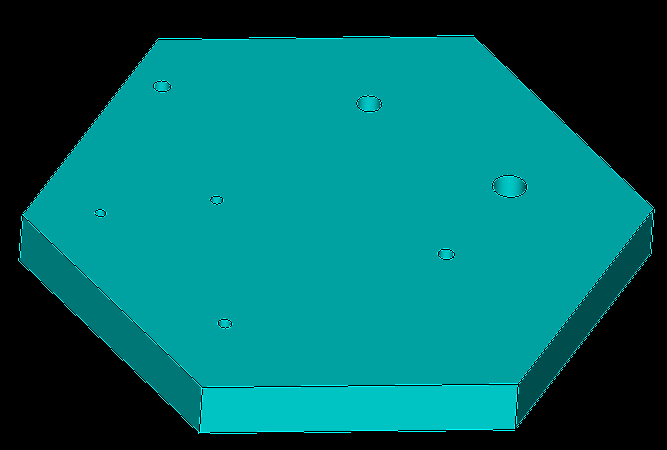
While this overall progress is correct, the amount of time spent in each step, as represented by the size of each box, is not. While one may think that the final step of running the simulation would require the majority of effort, this is far from truth, at least when focusing on the human labor. What instead takes up most time is step 2: meshing. Real-world CAD models tend to contain a large number of small features, such as screw holes and small protrusions. While these are clearly important for the actual assembly of the part, they are not really of much importance when it comes to modeling outgassing and contaminant transport. At the same time, they lead to major challenges in numerical simulations. Consider the dummy part in Figure 2. A meshing program attempts to capture the curvature of the holes by subdividing the edges of the curved conical sections into many segments. The surface triangles are then grown out of these edges and connected to the triangles emerging from the opposite end of the face. The small physical size of the drill holes leads to tiny triangles in the immediate neighborhood, and overall a massive number of triangles across the affected face. This can be seen in the second half of Figure 2. Such a mesh is problematic for particle-based simulations for two reasons. First, the computational time is proportional to surface mesh density as more triangles need to be checked for surface impacts. Second, counterintuitively, a fine mesh actually leads to worse results. Kinetic simulations require a high number of samples to reduce the statistical noise associated with random sampling. Small triangles are simply less likely to be hit by particles due to the small relative area. The combined outcome is that small features such as drill holes lead to simulations that take much longer to complete, while producing noisier results. This is not exactly a winning combination!
Solution
For this reason, geometry models typically need to be simplified. While some CAD programs attempt to automate this process by providing a “shrinkwrap” feature, this functionality is not universal. Usually the model needs to be redrawn manually, often in full, to eliminate small parts. As you can imagine, this becomes a highly time consuming task. We estimate that in our work, over 50% of analysis effort is spent on mesh preparation. For this reason, it is also not unusual for simulations to lag quite significantly behind the latest mechanical drawings. In essence, nobody has the time to be redoing the mesh every time the design changes. Elimination of meshing can thus lead to a massive reduction in analysis labor cost while also supporting rapid prototyping. A mesh-free analysis program could be automated to rerun the simulation every time the design changes, and even produce an updated report by an integration with data processing libraries such as VTK and one of the many PDF writers.
The need for surface mesh could be conceptually eliminated by running the simulation directly with the CAD geometry. CAD models are after all just analytical descriptions of the surface, often implemented using the generalization of cubic Bezier splines two three dimensions. CAD design programs also already internally implement line-geometry intersection functionality, if for nothing else than for ray tracing of realistic visualizations. Software libraries, such as Open CASCADE Technology (OCCT) make it easy to interface with CAD files stored in non-proprietary formats such as STEP. Our goals for the Phase I effort was demonstrating the feasibility of using OCCT in particle-based gas transport simulations.
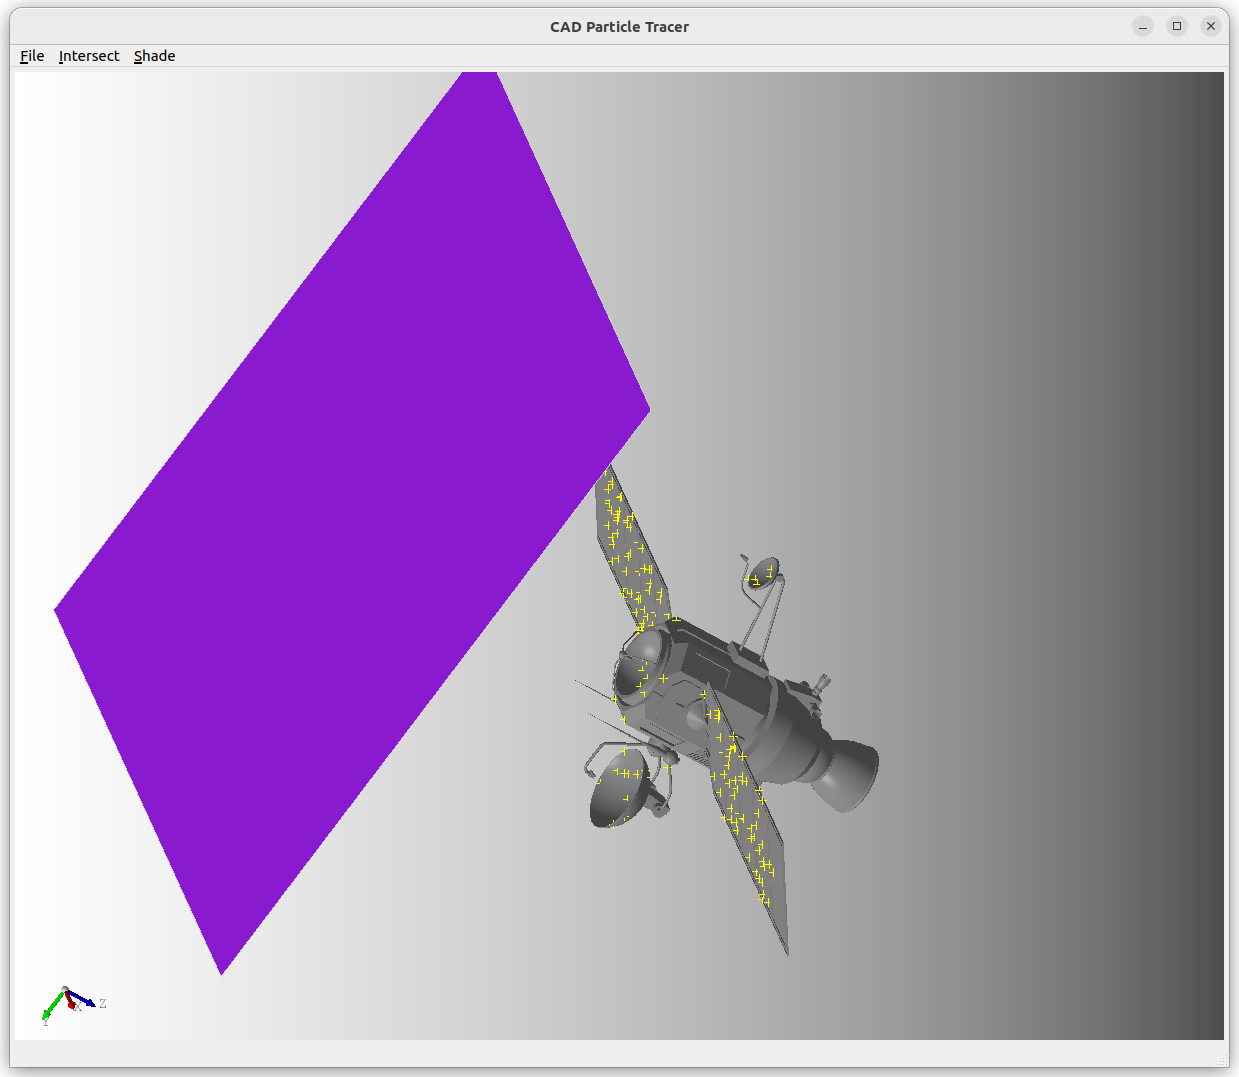
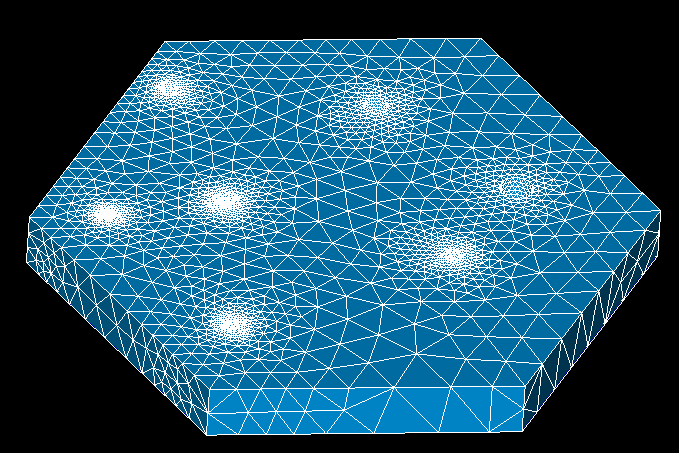
We started the effort by learning how to load and process STEP files. This is shown in the left half of Figure 3. We next learned how to find intersections between an arbitrary ray the surface. In this case, we let the use load another STEP file containing the emission geometry. Test rays were originated at random positions on this starting surface in the surface normal direction. The intersection points are marked by crosses in the second half of Figure 3. James was of great help here, parsing through the at times limited OCCT documentation. We also worked on this task just as ChatGPT came out, and found it quite useful for producing Open CASCADE code snippets.
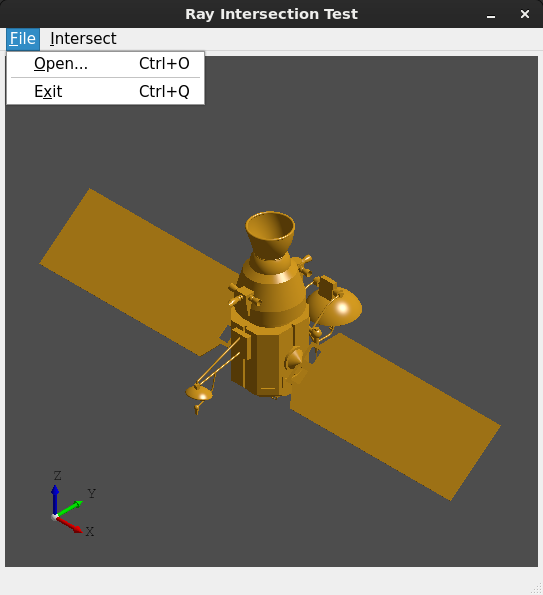
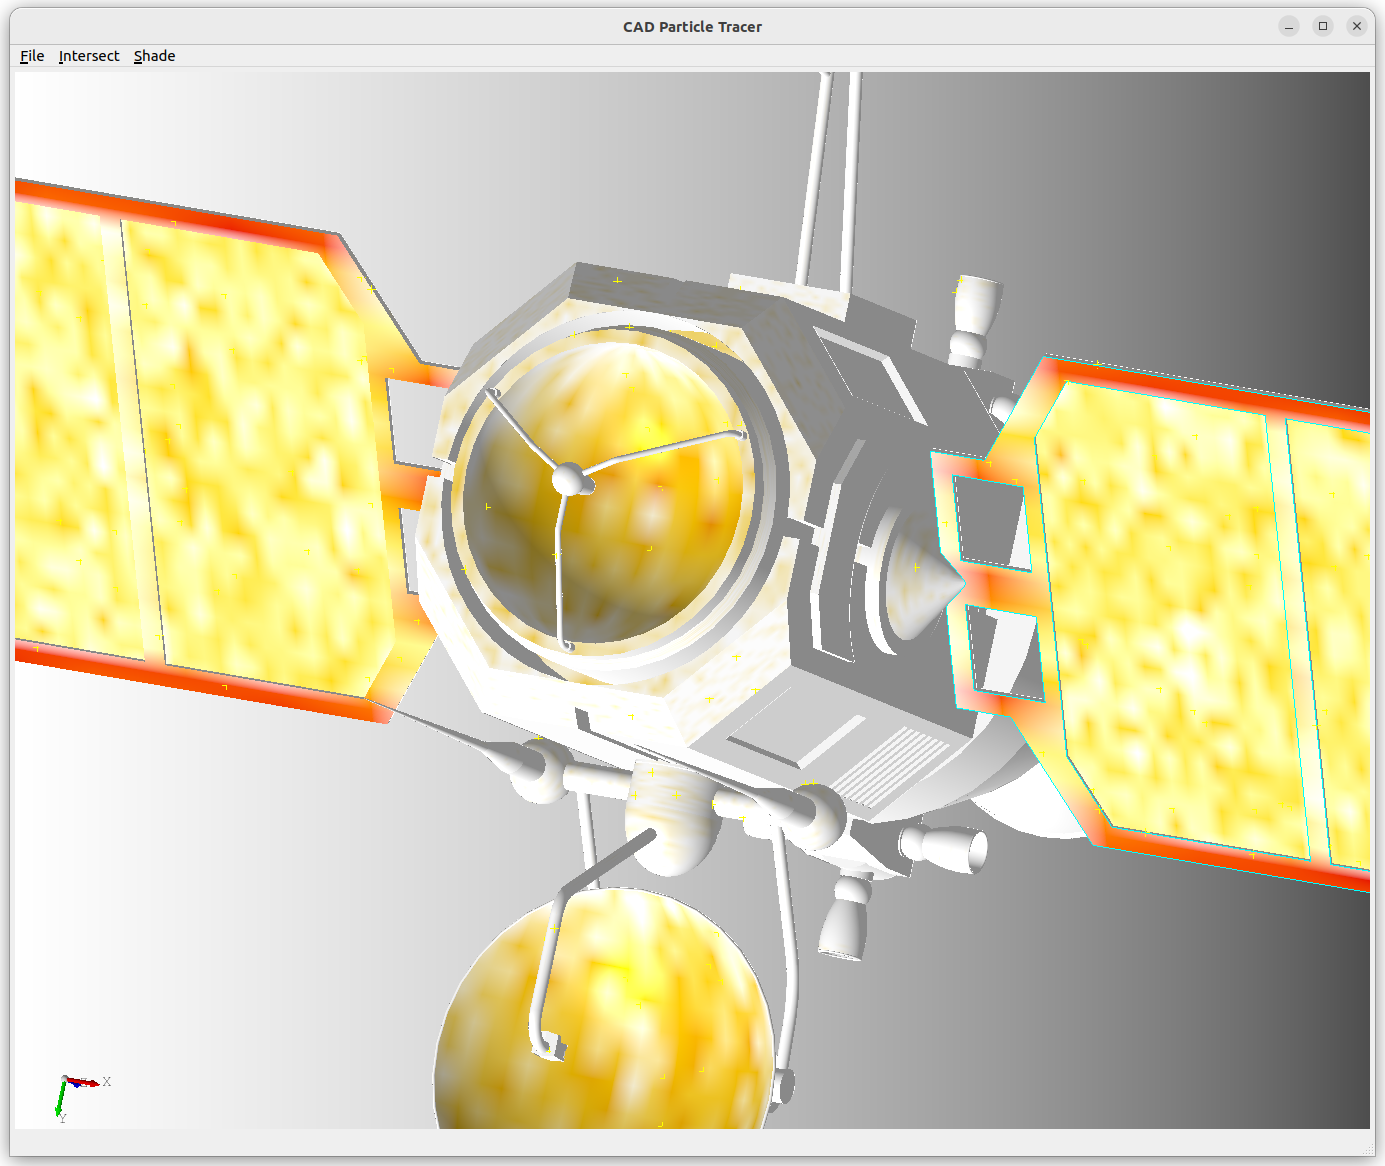
With this step completed, the next challenge involved determining, if and how, surface data can be stored. This storage needs to be bi-directional. First, particle impacts let us calculate important output data, such as surface deposition thickness or momentum flux. This requires being able to store data on the surface at the location of (or at least interpolated to nearby points) particle impact. Secondly, upon surface impact, we often need to sample some surface data corresponding to that location. This could be the local surface temperature, or the height of the already accumulated surface film, as such data may be needed to determine the post-impact particle behavior. Initially it was not clear just how this storage can be accomplished, but we found that it can be done relatively easily using textures. While we are still working out some kinks, Figure 4 demonstrates textures being used to visualize surface impact locations.
Another neat aspect of the direct use of CAD models is the ability to perform surface transformations to model deployments of appendages or the rotation of solar panels. This is visualized in Figure 5. Here we move and rotate the antenna while continuously tracking particle impacts. This functionality will open doors to new dynamic simulations that will make it feasible to study contamination transport throughout deployment or during lunar landing.
Finally, as part of this initial effort, we also performed a timing comparison. As expected, checking for line-CAD impacts is more computationally intensive than performing line-triangle intersection checks. With our sandbox code and the generic satellite shown here, we saw the time per particle surface hit check grow by almost 5 orders of magnitude with the CAD approach. However, we expect this ratio to decrease drastically as we optimize the algorithm. Primarily, our legacy mesh based CTSP code utilizes an octree to organize surface elements by their spatial location. Only the triangles in the vicinity of the particle are tested. We did not have anything similar implemented for the CAD sandbox, and thus the test was performed against the entire surface. Secondly, even though the computation for each CAD shape can be expected to take longer than performing the comparable check with triangles, one can also expect that a CAD model contains many fewer shapes. Consider a cylinder. A CAD model can represent the entire object using just three shapes: two circular discs and the rectangular wall. Couple hundreds of triangles are needed to capture this shape with a sufficient smoothness. Finally, we need to consider the combined model-to-solution time. With a more complex drawing provided to us by NASA, we found that we could in fact produce results in shorter time that was required just to generate the mesh. This is where the true time reduction is expected to be seen. As noted above, stay tuned for more updates. We anticipate having the beta version ready for customers by the end of 2024, just after the conference season. Do not hesitate to reach out if you are interested in trying out this modeling capability.