-
Filter by category:
- Apps
- Contamination
- Embedded Systems
- Field Solvers
- Interactive
- Mesh Generation
- News
- Numerical Methods
- Papers and Codes
- Plasma Simulation
- Starfish
- Surface Interactions
- Uncategorized
- Visualization
Posts in Category Visualization
2D Data Plotting
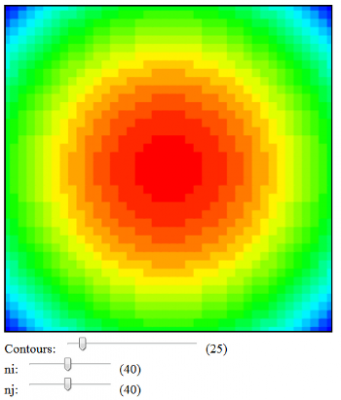
Demo of plotting 2D scalar mesh scalar values using HTML5 canvas and rainbow RGB colormap. (Mar 4 2014)
Converting Scalars to RGB Colormap
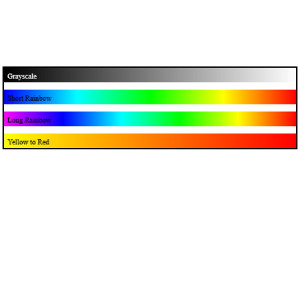
We can visualize variation of mesh-based scalars by converting each scalar to a color with the help of some colormap. This article describes how to convert a scalar to the rainbow colormap, which ranges from blue to red as the value increases from the minimum to maximum. (Mar 4 2014)
HTML5 + Javascript DSMC Simulation
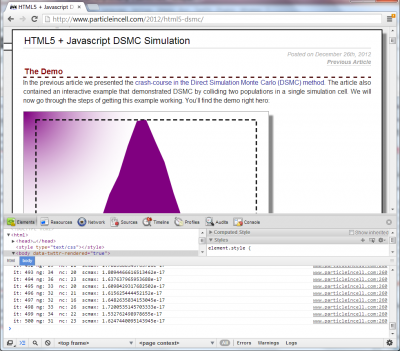
Details of the Javascript implementation of the Direct Simulation Monte Carlo (DSMC) method and a how to guide to plotting animated simulation results with Javascript and HTML5 canvas element. (Dec 26 2012)
Implementation of VTK-based 3D visualization capability in a solver GUI
Over the past few weeks, we at PIC-C have been busy integrating VTK (The Visualization Toolkit) into a client’s graphical user interface. The client for this project is a company specializing in CFD software for turbomachinery aerodynamic analysis. The client’s solvers are integrated with a Java-based GUI which allows the user to specify input parameters […] (May 3 2012)
Data Visualization with Java and VTK
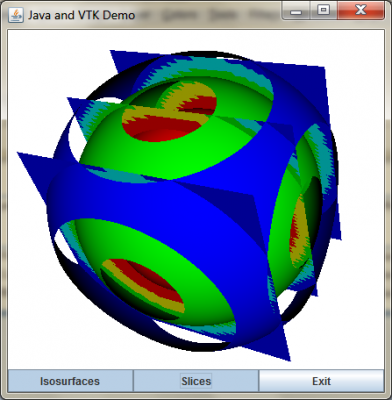
VTK is a powerful library for analyzing and visualizing scientific data. This example shows how to develop a simple Java application that uses VTK to render surface geometry, isosurfaces, and cutting planes. (Dec 16 2011)
HTML5 for Scientific Computing
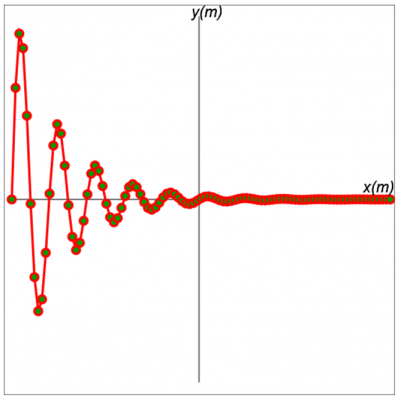
HTML5 is the new standard for writing webpages. It introduces several new powerful capabilities, such as embedded video and drag and drop. It also introduces a new tag called canvas that allows us to do real time graphing and visualization using Javascript. In this example we show you how to plot XY graphs using Javascript and HTML5. (Oct 28 2011)